
AnaChart vs WallStreetZen: Which Analyst Research Platform Gives You the Full Picture?
By Mathew Auto, AnaChart research desk.
Key findings
- 0% to 100%Share of Tesla targets reached across the 35 analysts with five or more targets and a target set in 2025 or 2026. The median is 80%.
- 4.6xHighest live Tesla target, $600, against the lowest, $130, with a median of $460.
- 85% to 98%Vijay Rakesh’s share of targets reached across 7 of 46 big stocks. Daniel Ives spans 65% to 93% across 7.
- 39 of 96Analysts with ten or more targets on three or more big stocks whose best and worst stock records differ by 30 points or more.
- 5.0%Median share price change 180 days after a target raise, against 3.0% after a cut, across 267,985 revisions.
Last updated: October 25, 2026
The short answer: Both AnaChart and WallStreetZen judge analysts by their track record, but they measure different things. WallStreetZen gives each analyst a single global rank (win rate and average return across everything they cover) and pairs it with its own quant Zen stock ratings and fundamentals forecasts.
AnaChart scores each analyst per stock, by whether their actual price targets came true, with full history since 2004.
If you want one headline “is this a good analyst” badge plus a broad research toolkit, WallStreetZen delivers it cheaply. If you want to know whether an analyst has met their targets on the specific stock in front of you, that is AnaChart.
Tesla makes the difference concrete. WallStreetZen rates Vijay Rakesh of Mizuho a “Top 1%” analyst and shows his $480 Buy, a clean badge earned across everything he covers. AnaChart confirms it and localizes it: on Tesla specifically, Rakesh has hit 32 of his 36 price targets (88.9%) since January 2025. The real gap shows up across the rest of the field, which a top-analyst filter never surfaces.
On the same stock, AnaChart shows George Gianarikas of Canaccord leading at 32 of 35 (91.4%) with the strongest performance score on the name, while JPMorgan’s Ryan Brinkman, a Tesla bear since 2018, has had just 18 of his 43 targets met (41.9%).
A single global badge cannot capture a spread that wide; a per-stock record can.
What WallStreetZen Does Well
WallStreetZen is a genuinely strong, affordable research toolkit. It ranks nearly 4,000 sell-side analysts by win rate, average return, and how often they pick, surfacing a curated set of “Top Analysts”, and wraps that in its own quant Zen Ratings (an A–F stock score), due-diligence checks, screeners, and multi-year EPS, revenue, and return-on-equity forecasts.
The Zen Rating model has a published long-run track record, and Premium is inexpensive at $19/month or $150/year. For an investor who wants a quant score, fundamentals, and a top-analyst filter in one place, it is a lot of value.
What AnaChart Measures Differently
AnaChart is narrower and deeper, and it differs from WallStreetZen in two ways that matter. First, it scores accuracy per stock, not globally: the same analyst gets a separate record on every name they cover, because hitting targets on Microsoft tells you little about hitting targets on a biotech.
Second, it measures price-target fulfillment, did the specific number actually get hit, and how bold and fast was the call, rather than a blended win rate on stock direction.
Add the full price-target history since 2004, a per-analyst timeline plotted against events, and the date each rating began, and you get a record built to answer “should I trust this analyst on this stock,” not just “is this analyst good in general.”
Of 96 analysts with ten or more targets on three or more of these stocks, 28 are above 80% on every stock and 39 have a gap of 30 points or more between their best and worst name. Vijay Rakesh, the analyst in the example above, runs from 85% to 98% across 7 stocks. Daniel Ives runs from 65% to 93% across 7, and Gil Luria from 20% to 95% across 12.
Key takeaway: Among 96 analysts covering several big stocks, 39 have a 30 point gap or more between their best and worst stock record.
AnaChart vs WallStreetZen: Feature Comparison
| Feature | AnaChart | WallStreetZen |
|---|---|---|
| Core approach | Per-stock price-target accuracy for every analyst | Global analyst ranking + quant Zen stock ratings |
| Accuracy granularity | ✓Per stock, same analyst scored separately on each name | ✗Global percentile across all coverage (e.g. “Top 3%”) |
| Accuracy metric | Price-target fulfillment + conviction/speed score | Average return, win rate & pick frequency (direction-based) |
| See every analyst’s record | ✓All analysts on a stock, openly | ✗Most analyst names locked behind Premium |
| Price-target history depth | ✓Every target & revision since 2004 | Recent targets; limited per-analyst history |
| Per-analyst price-target timeline vs events | ✓Each analyst’s targets over time against price & events | ✗No |
| Rating held since (per analyst) | ✓Start date of each analyst’s current rating | ✗Shows the latest action date only |
| Multi-analyst overlay on one chart | ✓Overlay 2+ analysts | ✗No |
| Quant stock rating & fundamentals forecasts | Limited, analyst-data focus | ✓Zen Ratings (A–F), EPS/revenue/ROE forecasts, screeners |
| Free access & pricing | Free Basic tier; Advanced $45/month | Free tier (gated); Premium $19/mo or $150/yr |
WallStreetZen details verified against wallstreetzen.com as of June 2026.
Global Rank vs Per-Stock Accuracy
WallStreetZen’s headline analyst signal is a global percentile, “Top 1%,” “Top 3%”, built from an analyst’s win rate and average return across everything they cover. It is a clean, useful badge, and WallStreetZen leans on it to surface a shortlist of top analysts.
But two things limit it.
The rank is global, so it cannot tell you how an analyst has done on the particular stock you are looking at; and on a free account most individual analyst names on a stock are locked behind Premium, so you see the consensus and a few top names rather than the full field.
AnaChart takes the opposite approach: it shows every analyst covering a stock and scores each one on that stock alone. The met ratio counts how many of their targets the stock actually reached within their horizon, and the per-stock performance score weights each target by conviction (how far it sat from the price when issued) and speed (how fast it was reached), counting misses as zero.
Because it is computed per analyst, per stock, you can see that an analyst who is elite in aggregate, like a “Top 3%” name, may rank near the bottom of the field on the specific stock you care about.
That is the gap a single global badge cannot show.
Read on 22 Oct 2026, the Tesla page lists 35 analysts with five or more targets and a target set in 2025 or 2026. Eight have reached 90% or more, four are at 100%, and six are below 60%. The median is 80%. Vijay Rakesh now stands at 35 of 41, George Gianarikas at 37 of 44 with a score of 7.36, and Ryan Brinkman at 18 of 43. Live targets run from $130 at Wells Fargo to $600 at Wedbush, 4.6 times from lowest to highest.
Key takeaway: On Tesla, 8 of 35 analysts with a live record are at 90% or better, 6 are below 60%, and live targets span 4.6 times.
Price-Target History, Plotted Against Events
AnaChart plots each analyst’s price targets over time against the actual share price, so you see behavior, not just a current number, who anticipated a move and who chased it, who held a thesis through drawdowns and who flipped after the news.
You can overlay two or more analysts on the same chart to see exactly where the Street splits and whose side has the better record.
WallStreetZen shows current ratings, price targets, and a top-analyst filter, but not each analyst’s full price-target trajectory plotted against the events that moved the stock.
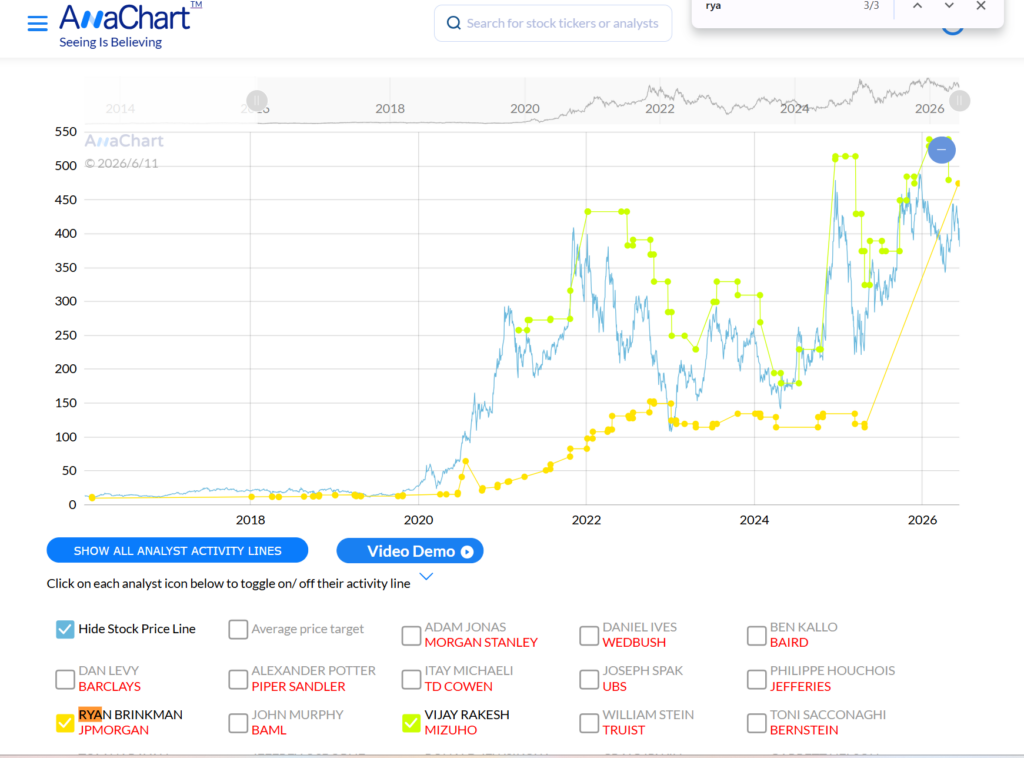
Plotting a target against the price that followed is the same test applied to every revision in the record. After 90 days the stock was higher in 56.6% of raises and 55.0% of cuts. After a cut the new target still sat a median 18.2% above the price, and 88.7% of cut targets stayed above it.
Key takeaway: After a target cut the new number still sat a median 18.2% above the price, and 88.7% of cut targets stayed above it.
Rating Tenure: How Long Has the Call Stood?
AnaChart shows the date each analyst’s current rating began, JPMorgan’s Ryan Brinkman, for instance, has held his Sell on Tesla since 2018. That tenure is its own signal: a rating held through years of volatility reflects conviction, while one changed last week is a fresh, untested view.
WallStreetZen shows the date of the latest action on a stock, which tells you when something last moved, not how long the prevailing view has actually held.
Three calls and what followed
On 10 Oct 2025, Tom Narayan of RBC raised his Tesla target from $325 to $500 with the stock at $413.49. Ninety days later it was $435.80.
On 23 July 2026, William Stein of Truist cut his Tesla target from $430 to $370 with the stock at $319.69. On 28 Sep 2026 the stock was $357.45.
On 18 Feb 2026, Patrick Colville of Scotiabank cut his Palo Alto target from $228 to $180 with the stock at $152. Ninety days later it was $240.
Pricing and Access
WallStreetZen: a free tier with limited analyst visibility; Premium is $19/month or $150/year, unlocking the full top-analyst forecasts, alerts, and Zen Ratings detail. AnaChart: a free Basic tier (sample stocks without registration, the Nasdaq 100 with a free account); Advanced is $45/month with a 7-day free trial, unlocking all 5,617 US-listed stocks, per-stock performance scores, multi-analyst comparison, and email alerts.
Institutions can license AnaChart’s full dataset warehouse-native through Corporate Access on Snowflake or Google BigQuery.
Which Tool to Use, and When
Choose WallStreetZen for an affordable all-in-one toolkit: a quant Zen Rating on the stock, fundamentals and earnings forecasts, screeners, and a quick filter to the analysts who rank well overall.
Choose AnaChart when the decision turns on a specific analyst on a specific stock, when you need to know whether the person behind a Buy or a $400 target has actually been accurate on this name, over years rather than in aggregate.
Use both. WallStreetZen frames the stock and points you to generally strong analysts; AnaChart tells you which of them has earned trust on the exact stock in front of you. (For more on how global analyst rankings work, see our AnaChart vs TipRanks comparison.)
Start where the example did: pick a stock you own and check who has actually met their targets on it, Tesla’s analyst track records are open right now, no sign-up required, or browse the top performing analysts by sector.
Mathew Auto is the byline of AnaChart’s research desk. Articles under this name are written by the AnaChart team from AnaChart’s record of 661,383 analyst price targets and 759,654 ratings, and every figure is checked against that record before it’s published.
Frequently Asked Questions
Is AnaChart or WallStreetZen better for analyst ratings?
It depends on the question you are asking. WallStreetZen is better for a quick, affordable verdict: a global analyst rank, a quant Zen Rating on the stock, and fundamentals forecasts in one place.
AnaChart is better for judging a specific analyst on a specific stock, whether their actual price targets have come true on that name, with a hit ratio and performance score going back to 2004.
Many investors use WallStreetZen to frame a stock and AnaChart to vet the individual analyst behind a call.
How is AnaChart’s analyst accuracy different from WallStreetZen’s?
WallStreetZen ranks each analyst with a single global percentile (e.g. “Top 3%”) based on win rate and average return across everything they cover. AnaChart scores each analyst per stock, based on price-target fulfillment, did their specific targets get hit, and how bold and fast were the correct calls.
The practical effect: on AnaChart, an analyst who is elite overall can rank poorly on the particular stock you are researching, because hitting targets on one name does not mean hitting targets on another.
Does WallStreetZen show every analyst on a stock?
Not on a free account. WallStreetZen surfaces the consensus and a curated set of top-ranked analysts, but most individual analyst names and targets on a stock are locked behind its Premium plan.
AnaChart shows every analyst covering a stock and their full per-stock record, including the ones who have been wrong, which is often the more useful half of the picture.
How much does WallStreetZen cost?
WallStreetZen has a limited free tier; its Premium plan is $19/month or $150/year, which unlocks forecasts from top analysts, alerts, and fuller Zen Ratings detail. AnaChart’s Advanced plan is $45/month and is focused specifically on per-stock analyst accuracy rather than quant ratings or fundamentals.
Is AnaChart free to use?
Yes. AnaChart’s core research is free: you can explore sample stocks without registering and the Nasdaq 100 with a free Basic account, including full analyst price-target history and per-stock accuracy records.
The paid Advanced plan ($45/month, 7-day free trial) unlocks all 5,617 US-listed stocks, per-stock performance scores, multi-analyst comparison, and email alerts.
What is a “Top Analyst” on WallStreetZen?
WallStreetZen ranks nearly 4,000 sell-side analysts by win rate, average return, and how frequently they make calls, then labels the strongest with a global percentile such as “Top 1%” or “Top 3%.” It is a useful aggregate measure of an analyst’s overall record, but it is not stock-specific, which is why AnaChart pairs it, in effect, with a per-stock accuracy record so you can see how a top-ranked analyst has actually done on the name in front of you.
Should I use AnaChart and WallStreetZen together?
Yes, they complement each other. WallStreetZen gives you a quant stock rating, fundamentals forecasts, and a fast filter to generally strong analysts, cheaply.
AnaChart then tells you which of those analysts has actually been accurate on the specific stock you are trading, with full price-target history and a per-stock performance score. Together you get both the headline quality signal and the stock-level proof behind it.
How wide is the spread of Tesla price targets on AnaChart?
As of 22 Oct 2026, live Tesla targets run from $130 at Wells Fargo to $600 at Wedbush, 4.6 times from lowest to highest, with a median of $460. Across 46 big stocks the median spread is 1.77 times. Gordon Johnson of GLJ sits apart at $24.86 with 0 of 10 targets reached.
See it in action, compare every analyst on a stock: