
StockAnalysis.com vs AnaChart
Last updated: July 3, 2026
The short answer: Use StockAnalysis.com when you want fast, free financials, statistics, and the analyst consensus on a stock — average price target, rating breakdown, and revenue and EPS forecasts — across 50,000+ tickers. Use AnaChart when you want to know which individual analyst to believe: each analyst’s hit ratio, performance score, and full price-target history on that specific stock. One gives you the crowd’s number; the other tells you whose number has actually met their targets.
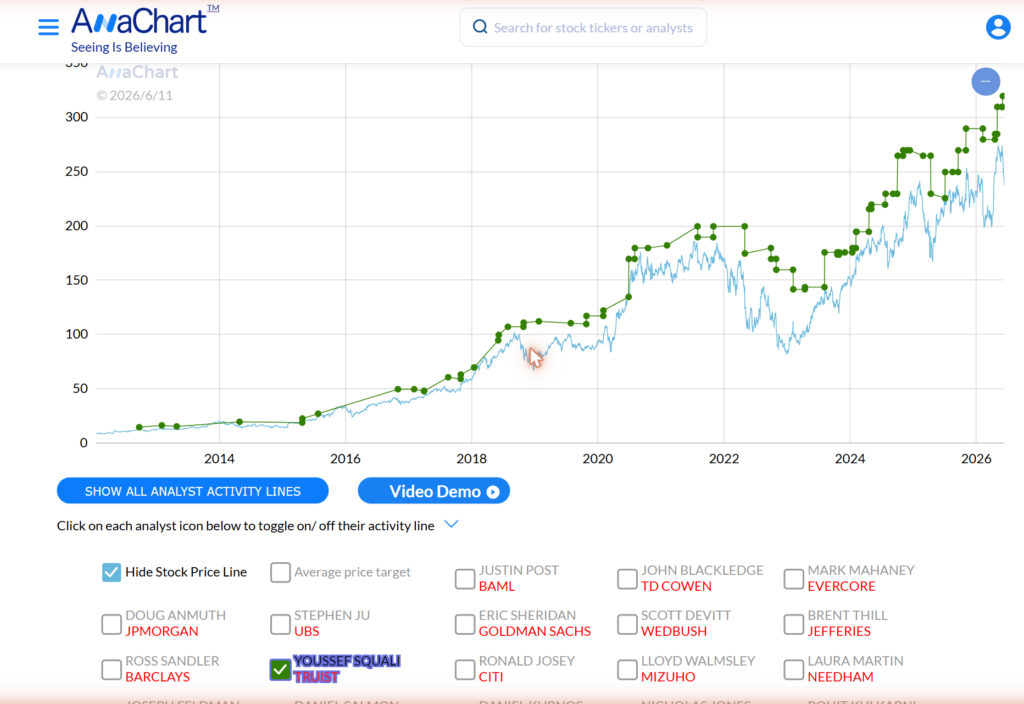
Take Amazon (AMZN) on June 11, 2026. StockAnalysis.com shows a clean consensus: 66 analysts, a “Strong Buy” rating, an average price target of $312.71, and a feed of recent changes — including Youssef Squali of Truist nudging his target from $310 to $320. Useful, but it stops there. AnaChart picks up that same Youssef Squali and adds the missing half: he has held his Buy on Amazon since September 2012 and has hit 48 of his 54 AMZN price targets (88.9%) over that span. Now his $320 call carries weight — you can see the track record behind it. That gap, consensus versus per-analyst accuracy, is what this comparison is about.
What StockAnalysis.com Shows You
StockAnalysis.com is one of the best free research sites on the web, and it earns that on fundamentals. For any of 50,000+ stocks, ETFs, and funds — US and international — it gives you clean financial statements, ratios and statistics, multi-year revenue and EPS forecasts, and a clear analyst snapshot: the consensus price target, the Buy/Hold/Sell distribution, a one-year recommendation trend, and a running list of the latest rating changes. Its analyst and forecast data is sourced from S&P Global Market Intelligence and TipRanks, and the free tier is unusually generous; Pro runs $9.99/month or $79/year. For a fast, uncluttered read on a company’s numbers and where the Street stands today, it is hard to beat.
What AnaChart Measures Differently
AnaChart is not a financials site and does not try to be. It does the one thing StockAnalysis does not: it measures and ranks the analysts themselves. Where StockAnalysis surfaces the consensus and the most recent rating changes, AnaChart keeps the full history of every sell-side price target since 2004 and scores each analyst on each stock by whether their targets actually came true. The output is a per-analyst, per-stock record — hit ratio, performance score, average time to target, and how long they have held their current rating — that answers a question consensus cannot: of the analysts covering this stock, who has earned the right to move it?
StockAnalysis.com vs AnaChart: Feature Comparison
| Feature | AnaChart | StockAnalysis.com |
|---|---|---|
| Primary focus | Sell-side analyst accuracy & price-target tracking | Financials, statistics & analyst consensus |
| Analyst-accuracy source | Computed in-house from its own 2004–2026 archive | Surfaced from third parties (S&P Global + TipRanks) |
| Per-analyst accuracy on a specific stock | ✓Hit ratio & performance score for every analyst on every stock | ✗Consensus + TipRanks global performance, not per-stock |
| Price-target history depth | ✓Every target & revision since 2004 | ~1-year consensus chart + recent rating changes |
| Per-analyst price-target timeline vs events | ✓Each analyst’s targets over time against price & events | ✗Consensus and latest changes only |
| Rating held since (per analyst) | ✓Start date of each analyst’s current rating | ✗Shows the latest change date, not how long it has been held |
| Multi-analyst overlay on one chart | ✓Overlay 2+ analysts | ✗No |
| Financial statements & revenue/EPS forecasts | Limited — analyst-data focus | ✓Extensive — multi-year forecasts, ratios, statistics |
| Coverage breadth | 5,617 US-listed stocks | 50,000+ incl. international stocks, ETFs & funds |
| Free access & pricing | Free Basic tier; Advanced $45/month | Generous free tier; Pro $9.99/mo or $79/yr |
StockAnalysis.com details verified against stockanalysis.com as of June 2026.
How Each Treats Analyst Accuracy
StockAnalysis.com gives you the consensus and the latest moves — exactly the right tool for “what does the Street think right now, and what do the fundamentals look like.” Its analyst-performance data, shown on the Top Analysts tab, is drawn from TipRanks, which ranks analysts globally across everything they cover on a relatively short recent window. That is a useful signal, but it is a third-party feed that inherits third-party limits: a single global rank rather than a per-stock one, and recent targets rather than a full history.
AnaChart computes accuracy itself, from its own archive, one stock at a time. Each price target is checked against what the stock actually did: the met ratio counts how many of an analyst’s targets the stock reached within their horizon, and the per-stock performance score weights each target by conviction (how far it sat from the share price when issued) and speed (how fast the stock got there), counting unreached targets as zero. Because everything is calculated per analyst, per stock, the best-rated analyst on Amazon can rank completely differently on Tesla — and a bold analyst with a few large, fast, correct calls can outrank a cautious one. That is a sharper, more surgical question than “what is the consensus.”
Price-Target History, Plotted Against Events
AnaChart plots each analyst’s price targets over time against the actual share price, so you see behavior, not just a number — who anticipated a move and who chased it, who held a thesis through drawdowns and who flipped the moment the news hit. You can overlay two or more analysts on the same chart to see exactly where the Street splits and whose side has the better record. StockAnalysis.com shows the current consensus, a one-year recommendation trend, and the latest rating changes, but not each analyst’s full trajectory or how it lined up with events.
Rating Tenure: How Long Has the Call Stood?
AnaChart shows the date each analyst’s current rating began — Youssef Squali’s Buy on Amazon has stood since September 2012. That tenure is its own signal: a rating held through years of volatility reflects conviction, while one changed last week is a fresh, untested view. StockAnalysis.com shows the date of the latest rating change, which tells you when something last moved — not how long the prevailing view has actually held.
Pricing and Access
StockAnalysis.com: a generous free tier covers financials, statistics, and consensus analyst data; Pro is $9.99/month or $79/year, with an Unlimited tier above it. AnaChart: a free Basic tier (sample stocks without registration, the Nasdaq 100 with a free account); Advanced is $45/month with a 7-day free trial, unlocking all 5,617 US-listed stocks, per-stock performance scores, multi-analyst comparison, and email alerts. Institutions can license AnaChart’s full dataset warehouse-native through Corporate Access on Snowflake or Google BigQuery.
Which Tool to Use — and When
Choose StockAnalysis.com for fundamentals and a fast read on the crowd: financial statements, forecasts, statistics, and the analyst consensus across a huge universe of stocks, ETFs, and funds, mostly for free.
Choose AnaChart when the decision turns on a specific analyst — when you need to know whether the person behind a Buy or a $400 target has actually met their targets on this stock before, over years rather than months.
Use both. StockAnalysis frames the company and the crowd’s view; AnaChart judges the individual analyst behind a call. They answer different questions and overlap surprisingly little. (For a head-to-head on the data source behind StockAnalysis’ analyst performance, see our AnaChart vs TipRanks comparison.)
Start where the example did: pick a stock you own and check who has actually met their targets on it — Amazon’s analyst track records are open right now, no sign-up required, or browse the top performing analysts by sector.
Frequently Asked Questions
Is StockAnalysis.com or AnaChart better for analyst ratings?
It depends what you mean by analyst ratings. For the consensus — the average price target, the Buy/Hold/Sell split, and the latest rating changes — StockAnalysis.com is excellent and free. For individual analyst accuracy — whether a specific analyst’s past targets on this stock actually came true — AnaChart is purpose-built, with a hit ratio and performance score for each analyst on each stock going back to 2004. Most investors are better served using both: StockAnalysis for the crowd view and the financials, AnaChart to judge the individual analyst behind a call.
Does StockAnalysis.com track individual analyst accuracy?
Partly, and through a third party. StockAnalysis.com surfaces analyst-performance data on its Top Analysts tab sourced from TipRanks, plus a feed of recent rating changes. But it does not compute each analyst’s accuracy from its own historical record, and the performance it shows is a global TipRanks ranking across everything an analyst covers — not a per-stock track record. AnaChart calculates accuracy in-house, per analyst and per stock, from its full archive of price targets since 2004.
Where does StockAnalysis.com get its analyst data?
StockAnalysis.com’s analyst ratings, price targets, and forecasts are sourced from S&P Global Market Intelligence and TipRanks. That means its analyst-accuracy layer reflects TipRanks’ methodology — a global analyst ranking on a relatively recent window — rather than data StockAnalysis computes itself. AnaChart, by contrast, builds its accuracy metrics from its own price-target database.
Is AnaChart free to use?
Yes. AnaChart’s core research is free: you can explore sample stocks without registering and the Nasdaq 100 with a free Basic account, including full analyst price-target history and accuracy records. The paid Advanced plan is $45/month with a 7-day free trial and unlocks all 5,617 US-listed stocks, per-stock performance scores, multi-analyst chart comparison, and email alerts. It is month-to-month.
How much does StockAnalysis.com cost?
StockAnalysis.com has a generous free tier that already includes financial statements, statistics, and consensus analyst data. Its paid Pro plan costs $9.99 per month or $79 per year, with an Unlimited tier above it that removes download, watchlist, and alert limits. For comparison, AnaChart’s Advanced plan is $45/month and is focused specifically on per-analyst accuracy rather than fundamentals.
Can I see an analyst’s full price-target history on a stock?
On AnaChart, yes — every price target and revision an analyst has issued on a stock is preserved since 2004 and plotted over time against the share price, so you can replay their full track record and judge them over a complete market cycle. StockAnalysis.com shows the current consensus, a one-year recommendation trend, and the most recent rating changes, but not each analyst’s complete history on a name.
Should I use StockAnalysis.com and AnaChart together?
Yes — they are complementary. StockAnalysis.com is the stronger tool for financial statements, multi-year forecasts, statistics, and a quick read on the analyst consensus across a very broad universe. AnaChart is the stronger tool for judging the individual analysts behind those ratings: who has been accurate on this specific stock, how bold and how fast their correct calls were, and how long they have held their current view. Used together, you get both the crowd’s number and the credibility of the people behind it.
See it in action, compare every analyst on a stock: