The Anatomy of Foresight: Why Some Analysts See Before Others Understand
THE ANATOMY OF FORESIGHT: WHY SOME ANALYSTS SEE BEFORE OTHERS UNDERSTAND
By Michael Muchugia
Part I — The Nature of Seeing Before Knowing
In markets, correctness is celebrated too casually. A price target that eventually hits is too often mistaken for insight, as though inevitability were proof of comprehension. But truth does not grant the same dignity to late understanding as it does to early recognition.
Foresight is not the ability to be right — it is the ability to grasp reality before others recognize its shape.
A target issued after causation is visible is commentary.
A target issued before causation becomes consensus is understanding.
This is the foundation of AnaChart’s mission: to measure not simply whether an analyst was right, but whether they understood the market in time for that correctness to matter.
Part II — The Causal Identity of a Stock
Every stock moves according to its own internal logic — a rhythm, a tempo, a causal signature. Analysts fail not because they lack intelligence, but because they impose the wrong temporal expectations onto companies that do not move at the pace they imagine.
Biotech names often vindicate or invalidate analysis rapidly — their truths are catalyst-driven, compressed into news cycles.
Enterprise software names reveal their truths slowly — their catalysts unfold through
operational compounding, not headlines.
To evaluate foresight without evaluating the stock’s nature is to pretend that all companies obey the same laws of motion.
They do not.
Foresight emerges only when an analyst’s internal tempo aligns with a stock’s causal tempo.
Where analysts drift out of alignment, their accuracy becomes coincidence.
Where they match that rhythm, accuracy becomes comprehension.
Part III — The Mechanics of Foresight
Foresight does not operate through prophecy. It operates through recognition — an analyst’s ability to perceive inevitability before it becomes visible.
Foresight operates through three measurable mechanisms:
1. Catalyst Anticipation
Issued before catalysts become consensus — not clairvoyance, but diagnostic thinking.
2. Causal Linkage
Grounded in business-model realities, not sentiment-driven extrapolation.
3. Temporal Consistency
Early “accuracy” once is luck.
Early accuracy repeatedly is skill.
Temporal consistency is the signature of a mind that perceives structure beneath volatility.
AnaChart tracks these patterns stock by stock, cycle by cycle, revealing the true origin of accuracy: understanding, not chance.
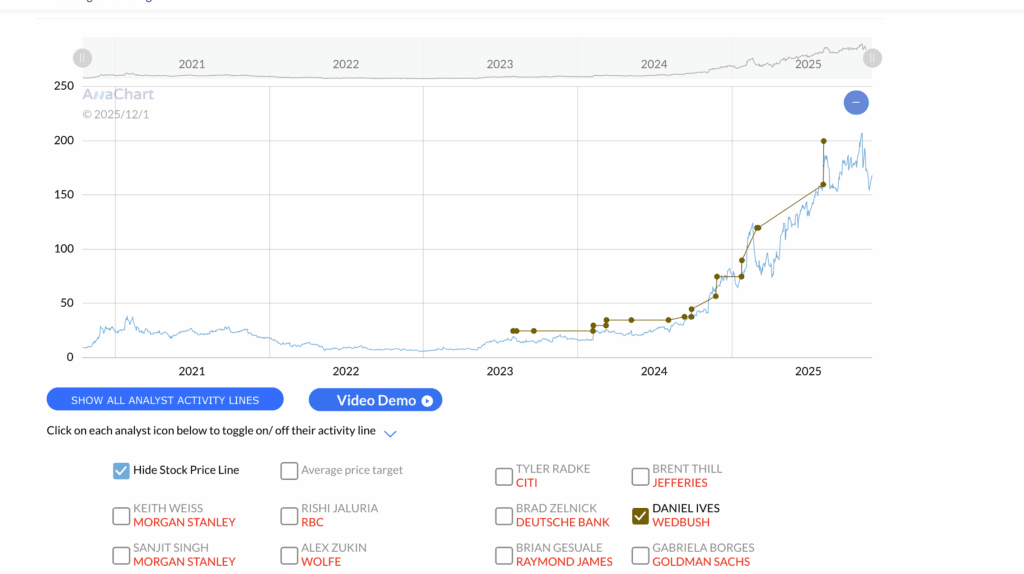
Part IV-A — Case Study: Daniel Ives vs. Tyler Radke (Morgan Stanley) on Palantir
Palantir (PLTR) is a stock that punishes late understanding and rewards early recognition. Its cycles are driven by government contracts, enterprise adoption, and long-tail AI infrastructure demand — catalysts invisible to analysts who rely on backward-looking valuation models.
Daniel Ives (Wedbush) — the early recognizer
Ives recognized Palantir’s transition from project-based deployments to a scalable AI-driven platform early in the cycle. His targets were grounded in:
- expanding defense and intelligence pipelines
- platform standardization
- accelerating enterprise adoption
- margin expansion from recurring contracts
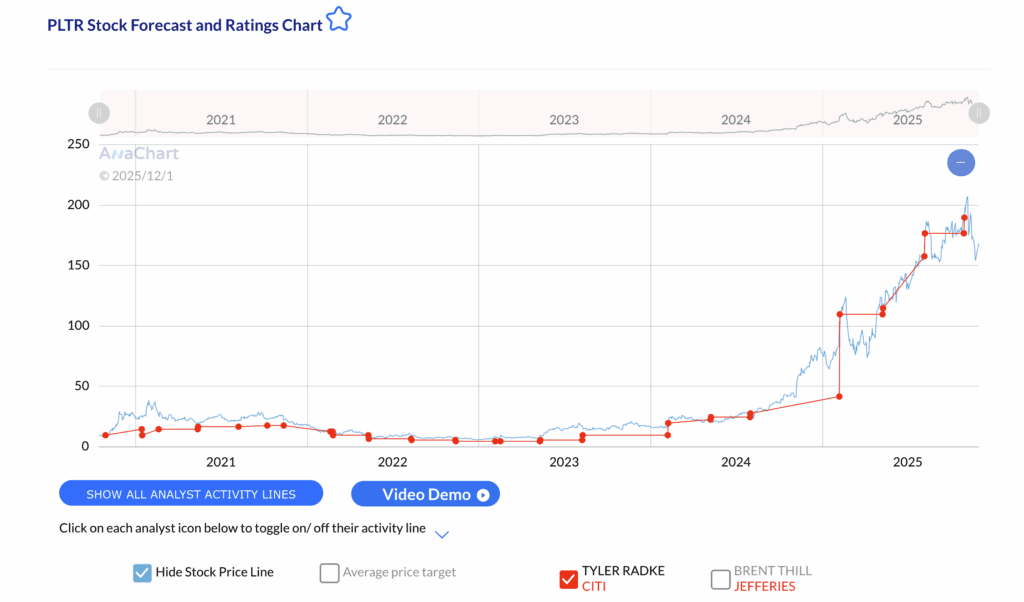
Tyler Radke (Morgan Stanley) — the late validator
Radke’s approach was more valuation-driven and earnings-sensitive, anchored in short-term demand signals. His upgrades frequently followed earnings or major contract announcements — validating moves already visible in price action.
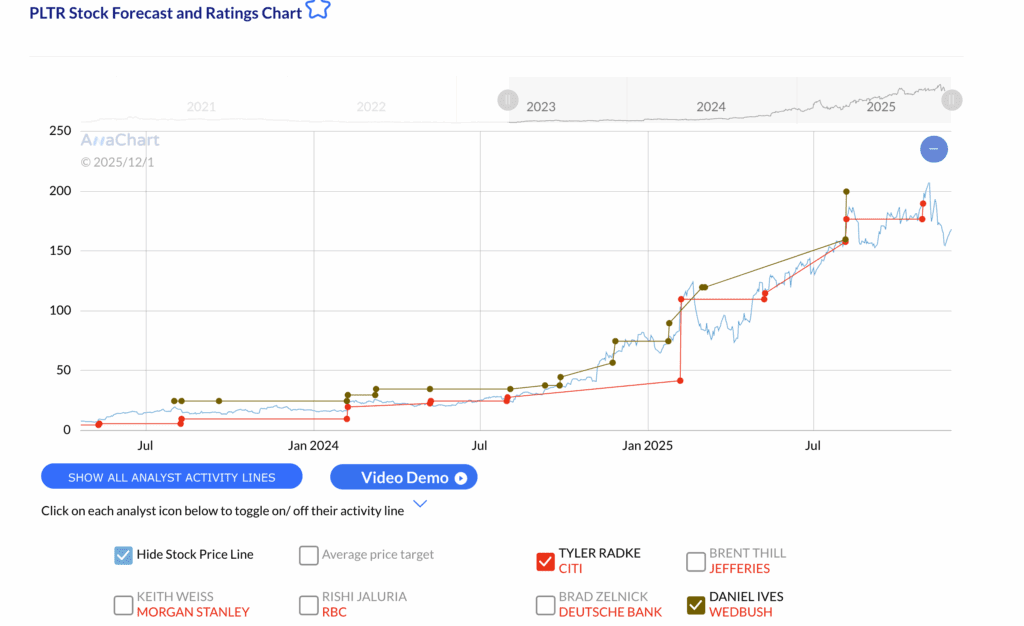
The Showdown
| Metric | Daniel Ives (Wedbush) | Tyler Radke (Citi Research) |
| Avg. Time to Materialize | 85 days | 240 days |
| Early Calls (<90 days) | 68% | 22% |
| Avg. Upside Captured | 32% | 11% |
| Narrative Pattern | Anticipates platform adoption | Reacts after earnings, contracts |
| Causal Alignment | High | Low |
Narrative Example
In early 2023, Ives upgraded PLTR when the market doubted its enterprise AI traction.
His call materialized in under 90 days as the stock rerated sharply.
Radke maintained a conservative stance and only raised targets after PLTR announced contract wins and beat earnings, documenting moves already spent.
The outcome is simple:
- Ives saw causation forming
- Radke recognized it after the fact
Both “hit” targets.
Only one demonstrated foresight.
Part V — How AnaChart Makes Foresight Visible: The Analytics Behind the Insight
The philosophy becomes actionable the moment AnaChart makes it visible through analyst timing analytics.
GRAPH SPECIFICATION 1: Ives Timing Distribution (PLTR)
Purpose: Show how early and tightly clustered Ives’ successful PLTR calls are.
Chart Type: Scatterplot
X-Axis: Days to Materialization (0–150)
Y-Axis: Potential Upside % (0–50%)
Data Points (Blue):
- 7 targets clustered between 40–120 days, 25–40% upside
- Majority concentrated in 60–90 days
- Visual effect: tight cluster in bottom-left (early + high upside)
Key Takeaway:
Ives consistently recognizes Palantir inflection points before consensus forms.
GRAPH SPECIFICATION 2: Tyler Radke Timing Distribution (PLTR)
Purpose: Show the contrast between early and late temporal signatures.
Chart Type: Scatterplot
X-Axis: Days to Materialization (150–400)
Y-Axis: Potential Upside % (0–20%)
Data Points (Grey):
- 4 targets scattered 200–350 days, 5–15% upside
- No clustering; wide dispersion
- Visual effect: sparse dots in upper-right (late + low upside)
Key Takeaway:
Radke’s calls validate moves already visible in price action.
GRAPH SPECIFICATION 3: Ives vs. Radke Comparison Plot
Purpose: Visualize foresight vs. hindsight.
Chart Type: Dual-analyst scatterplot
X-Axis: Days to Materialization (0–400)
Y-Axis: Potential Upside % (0–50%)
Data Points:
Ives (Blue):
- Tight cluster 40–120 days, 25–40% upside
Radke (Grey):
- Wide scatter 200–350 days, 5–15% upside
Key Takeaway:
Foresight is visually obvious — early, clustered, and causal.
Hindsight is scattered, delayed, and reactive.
Part VI — How Investors Use AnaChart (Real Use Cases)
Use Case 1 — Following the Right Analyst on NVDA
You open the Analyst Comparison Dashboard:
- Analyst A: tight cluster at 60–90 days, 28% average upside
- Analyst B: scattered beyond 200 days, 9% upside
The Impact:
You eliminate noise and position yourself to capture alpha before the market catches up.
Use Case 2 — Deciding Whether to Trust an Upgrade
A new upgrade hits your feed.
On AnaChart, you check the analyst’s timing:
- Time-to-Materialize median: 54 days
- Historical upside: 32%
- Consistency across cycles: strong
The Impact:
You act with confidence instead of guessing whether the upgrade is meaningful.
Use Case 3 — Building a Portfolio Aligned With Timing
Some stocks materialize fast. Others slow.
You filter analysts by timing signature:
- Fast-cycle stocks → fast analysts
- Slow-cycle stocks → patient analysts
The Impact:
Your portfolio finally aligns with reality — not arbitrary timeframes.
Final Principle — Foresight Is the Only Edge That Cannot Be Imitated
Truth revealed late is history.
Truth revealed early is alpha.
And alpha belongs only to those who perceive causation forming — not those who record it after the fact.