What Makes an Analyst Consistently Accurate?
By: Michael Muchugia
Over the past several years, a small subset of semiconductor analysts has maintained price target hit ratios above 95% across multiple NVIDIA cycles. That level of persistence is not random. It reflects measurable behavioral discipline.
This analysis examines four recurring analyst behavior patterns that correlate with repeatable forecasting performance:
- Target hit ratio
- Time-to-target efficiency
- Sector specialization
- Volatility sensitivity
Each pattern is measurable. More importantly, each has predictive implications for evaluating forward reliability.
Defining “Consistent Accuracy”
A single successful price target does not indicate forecasting skill.
For this study:
- A price target was considered “achieved” when the stock’s closing price met or exceeded the published target within a 12-month window from issuance.
- Hit ratio reflects the percentage of targets achieved within that window.
- Time-to-target measures the average number of calendar days required to reach the published target.
Consistent accuracy requires:
- Repeated target attainment across different market conditions
- Performance durability across volatility regimes
- Balanced calibration without chronic overshooting
- A measurable timing structure
Durability—not isolated success—defines structural forecasting discipline.
1. Target Hit Ratio: Calibration Over Optimism
What we measured: The percentage of published price targets reached within 12 months.
High hit ratios typically reflect:
- Realistic valuation assumptions
- Controlled multiple expansion expectations
- Adjustments driven by new information rather than price momentum
- Avoidance of extreme projections
Low hit ratios often signal:
- Chronic over-optimism
- Momentum-chasing revisions
- Poor risk calibration
What this predicts: Analysts with structurally high hit ratios tend to demonstrate persistence over time. Calibration discipline increases the probability of forward reliability.
2. Time-to-Target Efficiency: Timing Reveals Positioning Structure
Two analysts may both reach their targets. The timing often differs materially.
What we measured: The average number of days required for a stock to reach the published target.
Shorter time-to-target efficiency may suggest:
- Anticipatory modeling
- Alignment with upcoming earnings inflection points
- Strong incorporation of forward guidance
Longer timeframes may reflect:
- Multi-quarter structural modeling
- Focus on fundamental inflection points rather than near-term catalysts
- Deliberate valuation pacing aligned with longer investment horizons
What this predicts: Analysts who consistently reach targets within a defined and repeatable timing structure demonstrate disciplined positioning. Speed alone is not the signal; consistency is.
3. Sector Specialization: Depth Reduces Forecasting Noise
Broad coverage does not guarantee precision.
What we measured: The concentration of analyst coverage within specific industries.
Sector-specialized analysts often demonstrate:
- Deeper supply chain understanding
- Stronger management access
- More accurate peer-relative valuation framing
- Lower modeling variance within their domain
Diversified coverage can dilute domain depth.
What this predicts: Specialized analysts frequently exhibit lower performance dispersion within their core sectors. Knowledge concentration reduces structural forecasting error.
4. Volatility Sensitivity: Stability Under Stress
Market regimes shift. Earnings cycles introduce shock. Macro conditions evolve rapidly.
What we measured: Performance consistency during high-volatility periods versus stable environments.
Some analysts:
- Expand target dispersion during stress
- Frequently revise ratings under pressure
- Exhibit widening forecast error ranges
Others:
- Maintain model structure
- Avoid excessive reactive revisions
- Preserve calibration discipline despite noise
What this predicts: Analysts with low volatility sensitivity tend to sustain higher long-term hit ratios. Forecast durability is most visible during uncertainty.
Case Study: Two Paths to Consistent Accuracy on NVIDIA
To isolate analyst behavior from stock-specific effects, we hold the underlying security constant and compare forecasting discipline within the same market environment.
When performance is measured across multiple NVIDIA forecasts, two analysts demonstrate persistent accuracy through different execution structures:
- Vivek Arya — Bank of America
- Harsh Kumar — Piper Sandler
Both maintain hit ratios above 95% on NVIDIA coverage, with detailed price target progression shown from 2023 onward.
The coverage period spans multiple distinct semiconductor cycles, including:
- Pre-AI acceleration
- The 2023 AI infrastructure rally
- Subsequent volatility and sector rotations
The Metrics
| Analyst | Firm | Hit Ratio | Avg Days to Target | Performance Score | Total Predictions |
| Vivek Arya | Bank of America | 61/64 (95.31%) | 204 days | 3.08 | 64 |
| Harsh Kumar | Piper Sandler | 40/42 (95.24%) | 111 days | 6.62 | 42 |
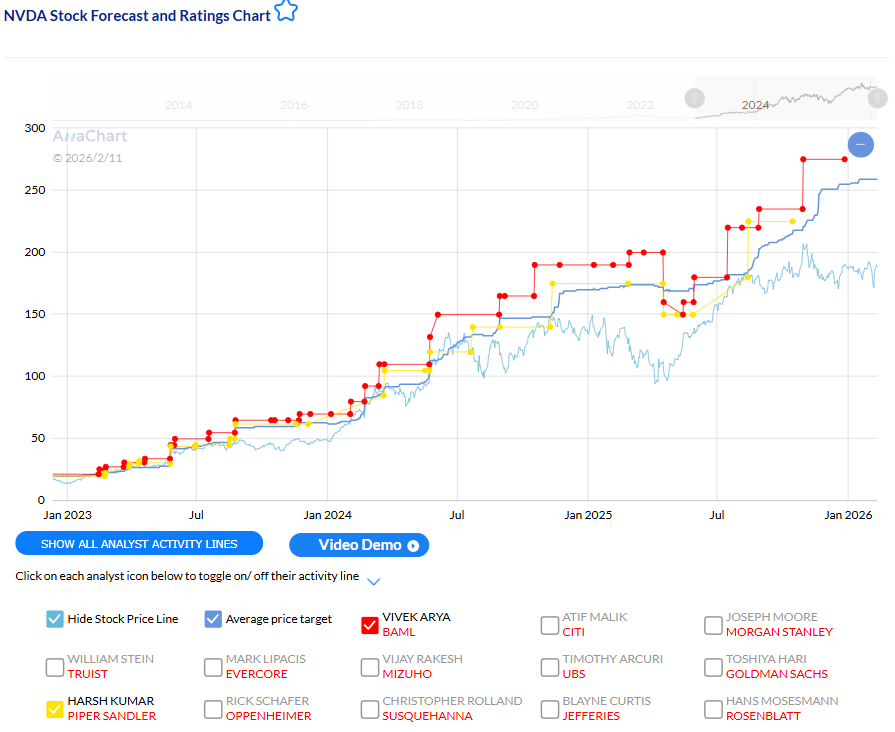
Figure 1: NVIDIA price targets by Arya (red) and Kumar (yellow) from 2023-2026. Both analysts maintained 95%+ hit ratios while operating on materially different timing structures.
The Performance Score integrates hit ratio, timing efficiency, and risk-adjusted calibration metrics. Kumar’s higher score reflects faster realization without sacrificing accuracy.
Accuracy levels are nearly identical. Execution timing differs materially.
Pattern Analysis: Vivek Arya
Target Hit Ratio: 95.31%
Across 64 NVIDIA targets, Arya maintains calibration discipline without chronic over-extension.
His forecasting profile reflects:
- Conservative but realistic modeling
- Adjustments tied to structural developments
- Controlled valuation expansion
Time-to-Target: 204 Days
Arya operates within a longer modeling horizon, reflecting:
- Multi-quarter earnings visibility
- Structural inflection focus
- Valuation pacing aligned with longer-term outlooks
His approach prioritizes durability over speed.
Sector Specialization
As a semiconductor-focused analyst, Arya’s coverage reflects domain depth:
- GPU supply chain insight
- Data center infrastructure understanding
- Competitive positioning awareness
Sector concentration reinforces consistency.
Volatility Sensitivity
Across multiple volatility regimes, including the 2023 AI surge and subsequent pullbacks, Arya’s hit ratio remained stable.
This indicates framework robustness rather than trend dependency.
Pattern Analysis: Harsh Kumar
Target Hit Ratio: 95.24%
Kumar achieves comparable calibration across 42 NVIDIA targets.
His pattern reflects:
- Anticipatory positioning
- Catalyst alignment
- Strong quarterly modeling discipline
Time-to-Target: 111 Days
Kumar reaches targets nearly twice as quickly as Arya.
Shorter realization windows reflect:
- Forward guidance integration
- Conviction ahead of earnings inflections
- Efficient cycle timing
Speed does not compromise reliability.
Sector Specialization
Like Arya, Kumar operates within concentrated semiconductor coverage. Domain familiarity enables faster execution without elevated forecast error.
Volatility Sensitivity
Despite operating on shorter timeframes, Kumar maintains a 95%+ hit ratio across volatile regimes. He adjusts positioning while preserving calibration discipline.
What the Contrast Reveals
Holding the stock constant reveals that persistent accuracy is not methodology-dependent. It is discipline-dependent.
Arya represents calibrated patience:
- Longer horizons
- Structural focus
- Reliability through conservative modeling
Kumar represents efficient anticipation:
- Shorter horizons
- Catalyst-driven execution
- Reliability through timing precision
Both achieve statistical durability through repeatable behavioral structure.
The Structural Profile of Persistent Accuracy
Across measurable dimensions, consistently accurate analysts tend to demonstrate:
- High but disciplined hit ratios
- Defined and repeatable timing structures
- Sector concentration
- Stability across volatility regimes
Accuracy persistence reflects calibrated modeling, domain expertise, timing awareness, and emotional discipline.
Predictive Implications for Investors
When evaluating analyst reliability, investors should examine behavior patterns rather than isolated calls:
- Does the analyst historically reach targets within defined timeframes?
- How consistently are those targets achieved?
- Is coverage concentrated within a domain of expertise?
- How stable is performance during volatility?
Analysts who sustain these behavioral patterns across multiple cycles tend to demonstrate persistence in forward forecasts.
Conclusion
Analyst accuracy is not random.
It emerges from repeatable, measurable behavioral discipline.
The Arya–Kumar comparison illustrates a broader principle: structurally different methodologies can produce equivalent reliability when execution discipline remains stable across cycles.
What matters is not whether an analyst is fast or patient.
What matters is whether their behavioral framework remains consistent under changing market conditions.
When that discipline persists, it becomes a measurable signal of forecasting durability—and a clearer lens for separating structural reliability from noise.