How to use AnaChart for your investment research?
By: Joseph Kalish
We will try to lay in this post out what we have identified where AnaChart as useful in unique ways.
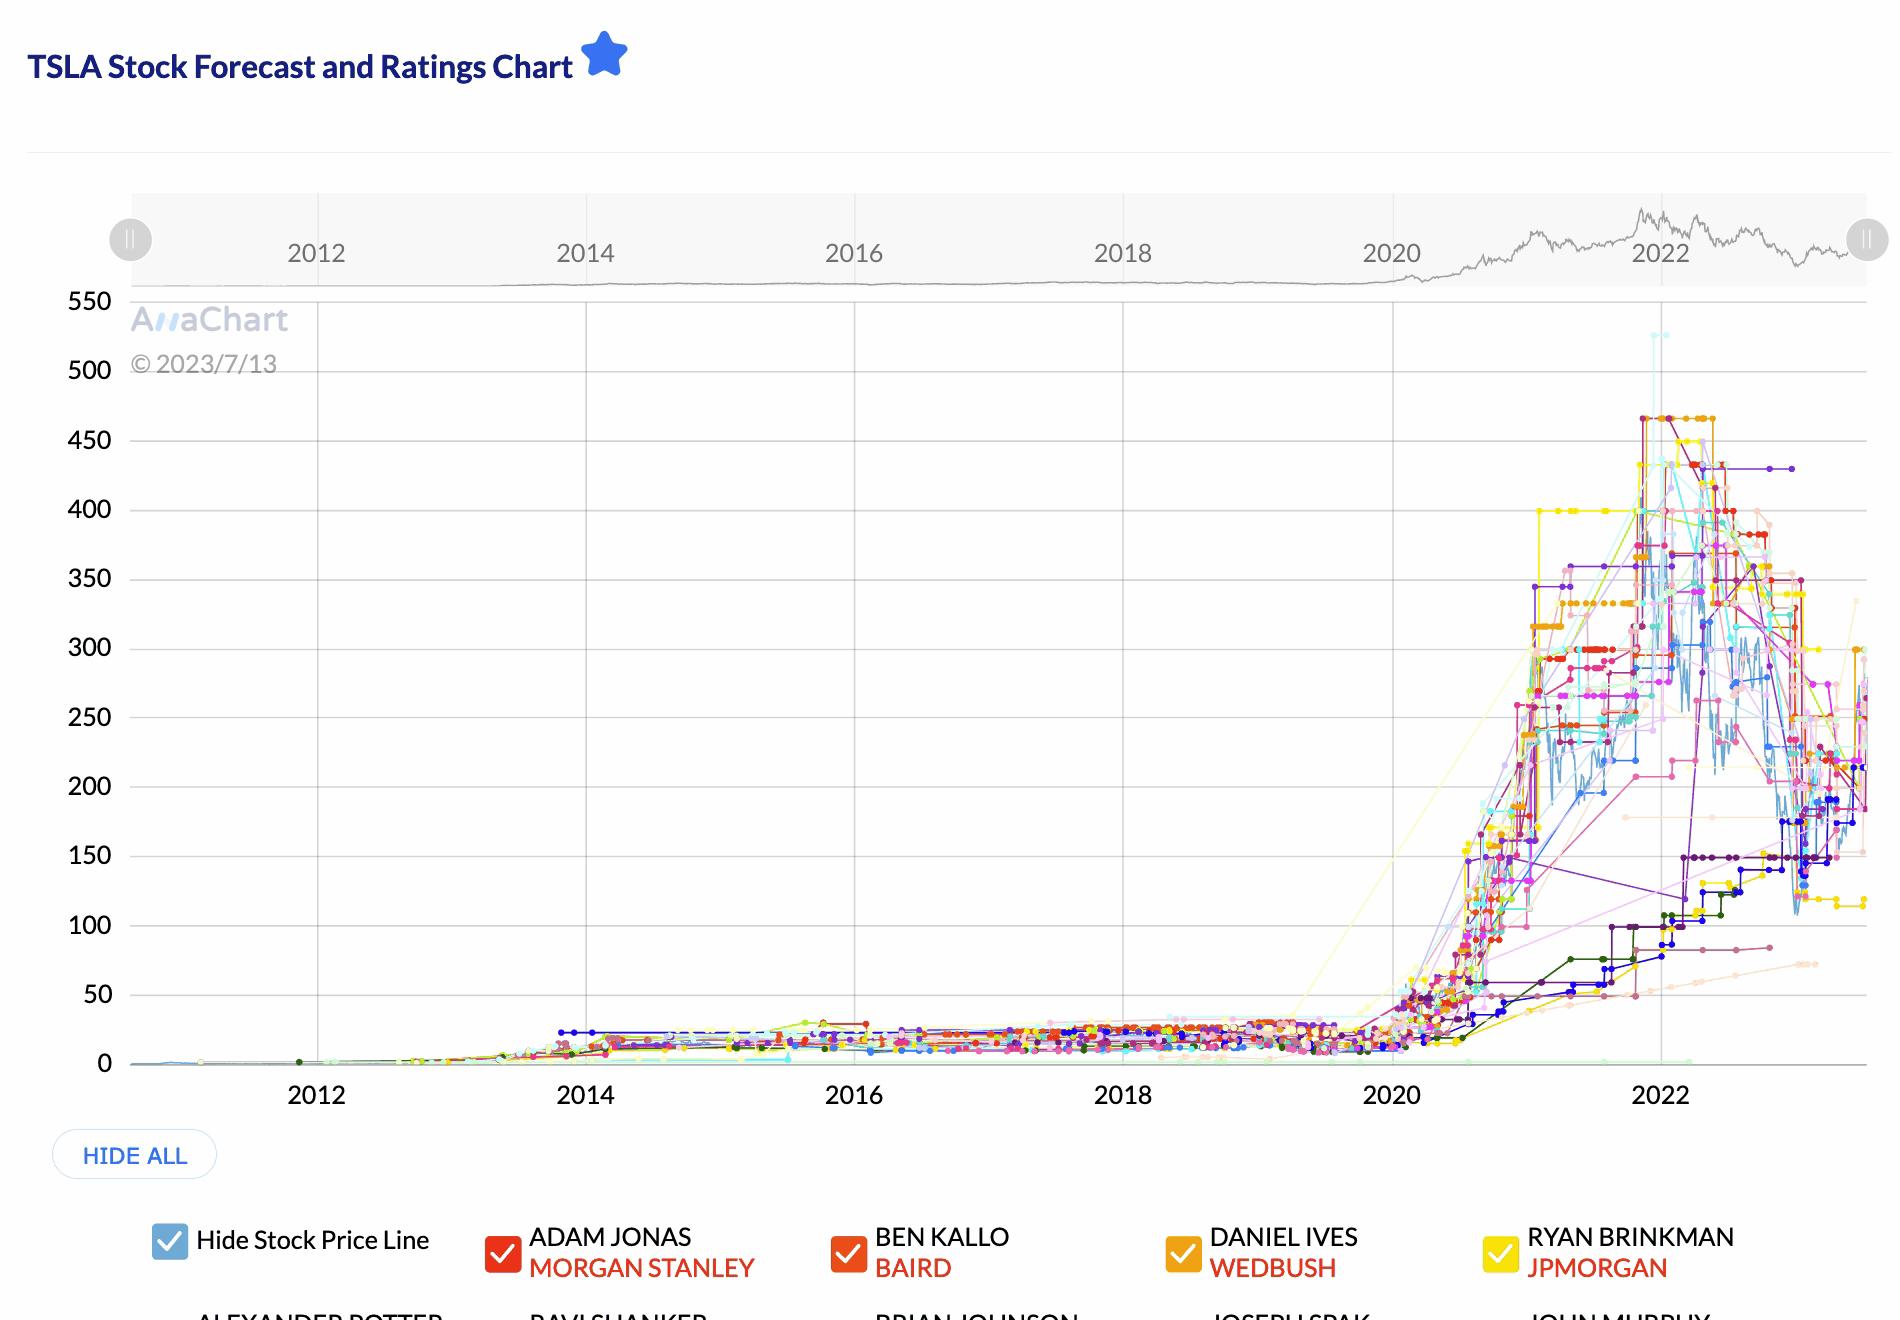
AnaChart is the only site that shows current AND previous stock price targets and rating (with the links as well as to news media that published it). Other sites show only previous ratings but not previous price targets.
You came up with a news item about an analyst giving an opinion about a stock that you have interest in and you wish to understand how successful they were before
On Anachart you can find the analyst, choose the relevant stock and see how hers/ his price targets and rating compared to the stock price.
By accessing the previous price targets you know instantly if the respective analysts was leading or lagging with his recommendation and by how much.
For example if looking at Daniel Ives from Wedbush when covering Tesla – we see that he did very well when raising his price targets and shifting from Neutral to Outperform. You can also see that in the first part of 2022 Ives didn’t adjust lower his price targets but later he did which shows a change on his perspective.
So the next time you receive news regarding Tesla you can have substantially better perceptive than anything else on the market.
If you don’t have access the previous price targets then you can’t have a perspective on the current one and then you are at the mercy of some score that is not very useful.
You wish to follow analysts with a proven track record on a specific stock
AnaChart is the only site that provide a performance score per stock and not per the entire work history of the analyst.
The idea behind the decision to do so is that an analyst do better on some stocks than with others.
When wishing to know which analysts performed better simply go to the receptive stock, go to the performance of scroll down, where you can sort each stock according their respective score.

The formula on which AnaChart provides the performance score per analyst on each stock is fully transparent.
Analysts that provide price targets that are not realistic IE the stock never reaches them have a score of zero for each such price target.
The longer it takes the stock to get to that price target the lower the score and the same if the price target is closer to the stock price on the day it was published.
This way analyst that provide price targets that are consistently met and within a reasonable time frame have higher scores.
Scores are averaged over the time that the analyst had been covering the stock.
You wish to know exactly where each analysts stands on your stock
Picture this – you’re trying to make an informed decision about investing in a particular stock. You come across an average price target or rating summary made from combined anonymous analysts. It’s a single, neat number, but what does it really tell you?
Now, compare that to having a list of price targets from named analysts, complete with dates. It’s a whole different ballgame, right?
Here’s why. Knowing individual price targets offered by named analysts not only gives you a range of perspectives but also allows you to peek into the minds of these market gurus. It offers a more detailed, nuanced picture, highlighting diverse opinions that exist for that particular stock. And let’s not forget, the date attached to each prediction matters. It’s like a time stamp that takes into account the market situation, industry trends, and other critical events at that particular time.

And the cherry on top? You can easily research the track record of each analyst, measuring their past predictions against actual outcomes. You get to know who’s been consistently accurate (or not), which could further guide your investment decisions. The average price target, on the other hand, is like a faceless crowd-sourced number. It lacks personality, detail, and context. So, next time you’re hunting for investment insights, remember – it’s not just about a single number. It’s about the who, the when, and the why behind each prediction. Invest smart!
Related Reading
🔍 See Real Analyst Track Records on AnaChart
AnaChart tracks 4,000+ Wall Street analysts — see their price target history, accuracy rate, and performance score for any stock.