
Wall Street's Most Accurate Analysts Aren't the Ones You Should Follow
Wall Street’s most accurate analysts aren’t the ones you should follow
An AnaChart data study, based on 661,383 analyst price targets and 759,654 ratings tracked since 2008. Data as of July 2026.
The finding: the analyst who hits their price targets most often is frequently not the best one to act on. A target that is eventually reached but takes nine months to get there is worth far less than one reached in three. Across the major U.S. stocks we examined, career hit rates ran from 42% to 94% — but the ranking flips once you account for speed and conviction.
The 89% analyst who ranks below the 65% analyst
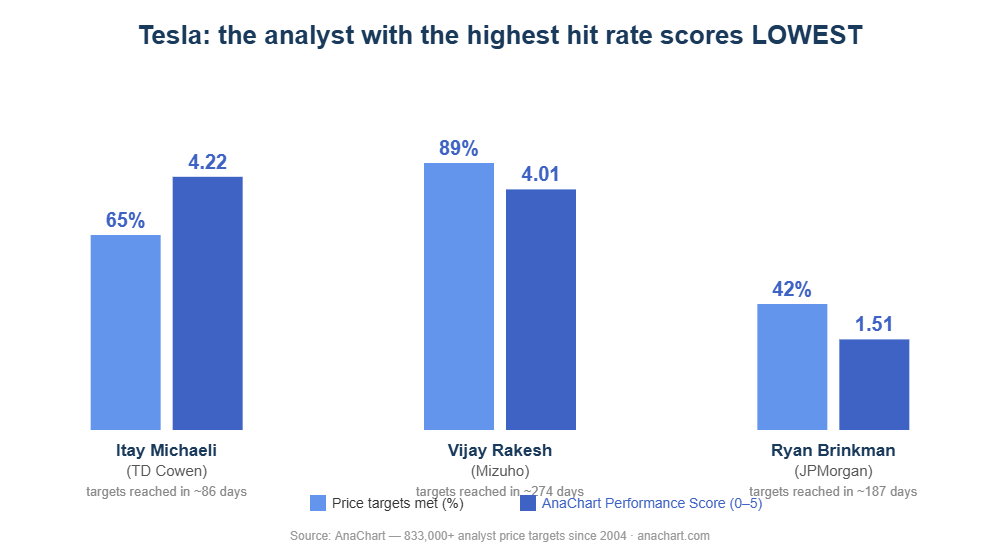
Tesla is the clearest example. Three analysts, three very different records: Vijay Rakesh (Mizuho) met his price targets 89% of the time; Itay Michaeli (TD Cowen) met just 65%; Ryan Brinkman (JPMorgan) met 42%.
By hit rate alone, Rakesh wins in a landslide. But AnaChart scores Michaeli higher — 4.22 versus 4.01 — because Michaeli’s targets are reached in an average of 86 days, while Rakesh’s take 274. That is a 188-day gap on the same stock. A 65% call you can act on this quarter beats an 89% call that pays off next year.
Accuracy varies more than you would think, and hit rate hides it
Ten numbers from the data:
- Hit rates span 42%–94% among the analysts we examined — a 52-point gap on the same job.
- Jeffrey Holford (KeyBank) had the highest hit rate: targets met 94.2% of the time across 193 documented targets.
- Jason Gabelman (TD Cowen) — 82.2% across 584 targets on energy names.
- Kimberly Greenberger (Morgan Stanley) — 77.3% across 907 targets.
- Devin McDermott (Morgan Stanley) — 73% across 1,540 documented targets: high conviction at scale.
- Ingo Wermann (BMO) — 87.3% on Microsoft coverage.
- Beware small samples: Richard Purkiss (Piper Sandler) shows 90% — on just 41 targets.
- A career average hides stock-specific records: Matt Miksic (Barclays) is 48% over his career but 95% on Johnson & Johnson (41 of 43).
- On Tesla, three times faster beat 24 points of hit rate — Michaeli outscored Rakesh despite meeting targets 24 points less often.
- The full dataset: 661,383 price targets and 759,654 ratings, 18 years, 7,191 analysts.
Why this matters
The number every finance site quotes — “this analyst is right X% of the time” — is the least useful one on its own. It says nothing about when the target is reached or how much upside was on the table. An analyst who has met their targets 60% of the time, quickly, with room to run, is a better analyst to follow than one who has met them 90% of the time, slowly, at the buzzer. That is why AnaChart scores all three dimensions instead of publishing a hit-rate leaderboard.
See it for your own stock
AnaChart ranks every analyst covering a stock by whether their price targets were met, how fast, and by how much — free for six stocks, no signup. See how accurate analyst price targets really are, or check the analysts covering Tesla (TSLA). The full 833k-target dataset is available as the analyst price target dataset for research and licensing.
Frequently asked questions
Who is the most accurate Wall Street analyst?
By raw hit rate, the most accurate analyst in our sample was Jeffrey Holford (KeyBank), whose price targets were met 94.2% of the time across 193 documented targets. But hit rate alone is misleading — the best analyst to follow is the one whose targets are met often, fast, and with margin, which is what AnaChart’s performance score measures.
Does a high hit rate mean an analyst is worth following?
Not on its own. On Tesla, Vijay Rakesh (Mizuho) met 89% of his price targets but scored below Itay Michaeli (TD Cowen), who met just 65% — because Michaeli’s targets were reached in 86 days versus Rakesh’s 274. A target reached slowly is worth far less than one reached quickly.
How does AnaChart measure analyst accuracy?
AnaChart combines three things across 661,383 price targets and 759,654 ratings since 2008: the price-target-met ratio (how often the target was reached), the average days to target (speed), and the average potential upside (margin) — into a single performance score per analyst, per stock.