
When Top Analysts Disagree — What History Shows
By: Michael Muchugia
Consensus is often interpreted as clarity.
Disagreement, however, may contain more information.
When analyst price targets cluster tightly, the market narrative is usually well defined. When targets diverge meaningfully, expectations become less settled, and dispersion itself becomes a measurable signal.
The relevant question is not who is right.
The relevant question is what disagreement historically implies.
Understanding Target Dispersion
Target dispersion measures the spread between the highest and lowest published price targets within active analyst coverage.
The dispersion reflects differences in modeling assumptions. Analysts may disagree on revenue growth expectations, margin sustainability, capital intensity, or valuation methodology. When these inputs vary significantly across firms, the resulting targets naturally diverge.
Dispersion is therefore not opinion.
It is a structure.
A narrow range indicates that analysts are broadly aligned in their expectations. A wide range suggests that the forward outlook is being interpreted through competing frameworks.
Wide vs. Tight Consensus Spreads
Tight Consensus Bands
When price targets cluster within a narrow band, analysts typically share similar assumptions about revenue growth, operating margins, and valuation multiples. In these environments, expectations are relatively stable, and revisions tend to occur gradually as new information becomes available.
Historically, tight dispersion is associated with lower forecast volatility and more incremental estimate revisions.
Wide Consensus Bands
Wide dispersion occurs when analysts disagree on the business’s trajectory. This often occurs during periods of transition — following major earnings inflections, regulatory developments, or structural changes to a company’s business model.
In these situations, analysts may apply different scenario assumptions or valuation frameworks, producing a wider spread between the highest and lowest targets.
Disagreement tends to rise when narrative clarity is lowest.
Does Disagreement Have Predictive Value?
Historical observation suggests several structural tendencies.
First, high dispersion frequently precedes convergence. As companies report additional earnings data, modeling assumptions become easier to validate, and analysts gradually migrate toward tighter alignment.
Second, wide dispersion is often associated with a higher frequency of revisions. When assumptions differ widely across coverage, new information forces analysts to recalibrate their models more frequently.
Third, dispersion tends to appear during periods of regime uncertainty. Companies undergoing strategic pivots, margin resets, or business model transitions often exhibit wider analyst target spreads.
Importantly, disagreement itself does not predict direction.
What it predicts is variability.
Case Study 1 — Tesla (2022)
Tesla presented one of the most visible examples of analyst disagreement during 2022.
In mid-2022, Adam Jonas of Morgan Stanley maintained a $220 price target on Tesla, reflecting expectations of sustained margin leadership and long-term autonomous-driving optionality. At the same time, Gordon Johnson of GLJ Research held a sharply lower $67 target, citing concerns about demand sustainability and valuation assumptions.
This represented one of the widest target spreads among large-cap equities at the time.
The disagreement reflected fundamentally different interpretations of Tesla’s margin durability and long-term growth trajectory. As subsequent earnings reports clarified margin trends and production growth, dispersion across coverage gradually narrowed.
Figure 1: Analyst price target dispersion on Tesla.

Morgan Stanley analyst Adam Jonas maintained significantly higher targets than GLJ Research analyst Gordon Johnson during the period.
Case Study 2 — Meta Platforms (2022–2023)
Analyst disagreement also became pronounced during Meta Platforms’ transition period in 2022.
At the time, Justin Post of Bank of America held a $233 price target, arguing that advertising recovery and cost discipline could restore operating leverage. In contrast, Eric Sheridan of Goldman Sachs lowered his target to $136, reflecting concerns about the scale of investment in Reality Labs and the potential pressure on margins.
The wide dispersion reflected uncertainty around Meta’s capital allocation strategy and the timeline for monetizing its metaverse investments.
As Meta implemented cost reductions and demonstrated margin recovery during 2023, the dispersion across analyst targets narrowed meaningfully.
Figure 2: Analyst price target dispersion on Meta Platforms.
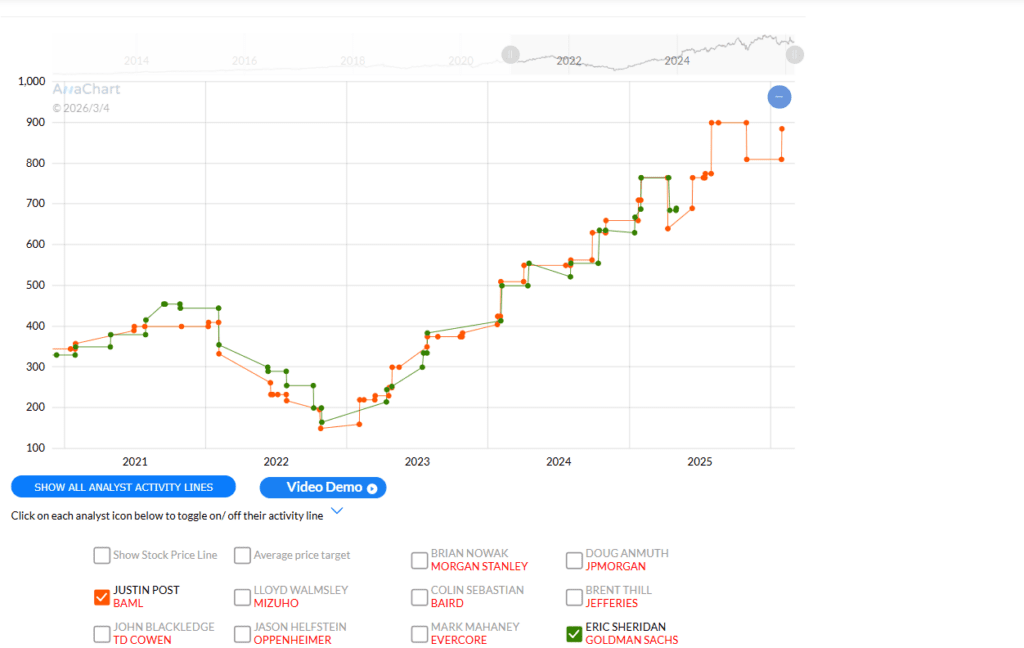
Bank of America analyst Justin Post maintained higher targets than Goldman Sachs analyst Eric Sheridan during Meta’s 2022 transition period
Case Study 3 — Netflix (2022 Subscriber Reset)
Netflix experienced similar analyst disagreement following its subscriber contraction in early 2022.
The period saw rapid shifts in analyst expectations as subscriber losses and subsequent strategic changes altered the company’s growth outlook.
During that period, Doug Anmuth maintained a $425 price target, reflecting confidence in long-term subscriber growth and pricing power. Meanwhile, Michael Nathanson set a significantly lower target of $225, citing concerns about streaming competition and subscriber churn.
The divergence reflected fundamentally different expectations about Netflix’s long-term growth trajectory and competitive positioning within the streaming market.
As subscriber growth stabilized and the company introduced its advertising-supported tier, dispersion across coverage gradually compressed.
Figure 3: Analyst price target dispersion on Netflix.
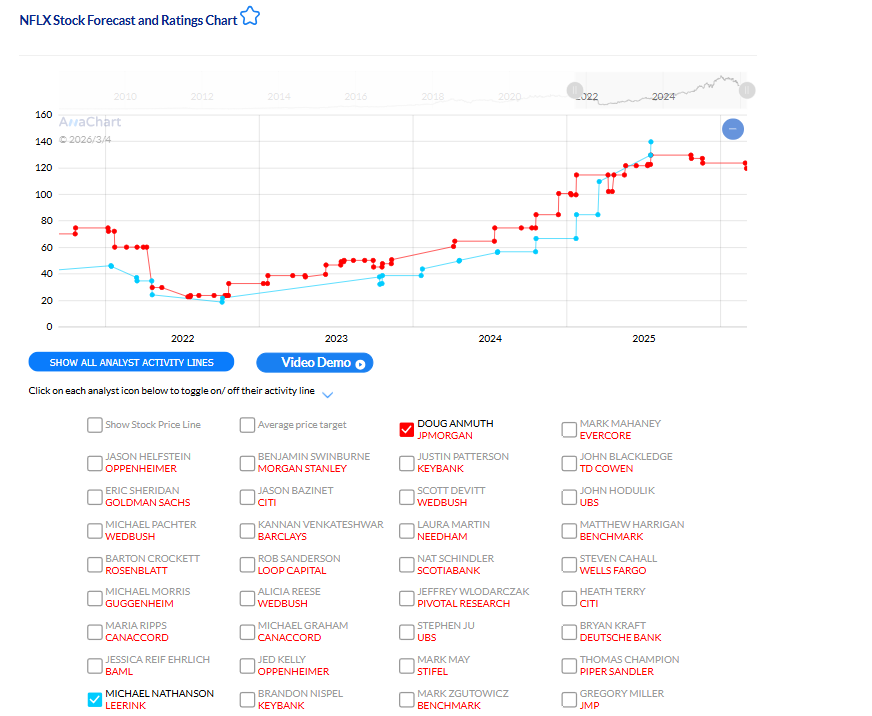
JPMorgan analyst Doug Anmuth maintained higher targets than analyst Michael Nathanson during Netflix’s 2022 subscriber reset period.
What Investors Should Monitor
The Tesla, Meta, and Netflix examples illustrate how wide analyst dispersion often reflects competing interpretations of a company’s future earnings trajectory rather than simple differences of opinion.
When dispersion expands meaningfully, several structural questions become relevant.
Analysts may differ in earnings assumptions, valuation frameworks, or interpretations of structural changes in the business.
Target dispersion becomes most informative when evaluated alongside revision velocity, rating changes, and estimate dispersion across the analyst community.
Disagreement is rarely random.
It reflects modeling uncertainty.
Structural Takeaway
Top analysts disagree most when forward visibility is lowest.
Over time, dispersion tends to resolve in one of two ways. Either earnings clarity compresses the range of expectations, or structural shifts reset consensus entirely.
The signal is not the magnitude of the highest target.
The signal is the width of the band.
Consensus tells you what analysts think.
Dispersion tells you how certain they are.
Related Reading
- Contrarian Analysts Who Beat Consensus
- What Makes an Analyst Consistently Accurate?
- Patterns Behind Analyst Price Target Changes
🔍 See Real Analyst Track Records on AnaChart
AnaChart tracks 4,000+ Wall Street analysts — see their price target history, accuracy rate, and performance score for any stock.
When Top Analysts Disagree: FAQ
What does it mean when top analysts disagree on a stock?
Disagreement is common and healthy — strong analysts often reach different price targets from the same facts. History shows the resolution usually favors the analyst with the better track record on that specific stock, not simply the better-known firm.
How do I decide which analyst to believe when they disagree?
Compare their per-stock met ratios and performance scores on AnaChart. Two analysts with the same Buy rating can have very different histories of being right on that name.
Can I compare two analysts’ price targets side by side?
Yes. AnaChart lets you overlay multiple analysts’ price-target histories on the same stock chart, so you can see exactly where they split and whose side has been more accurate.
Related on AnaChart: browse the top performing analysts by sector, and compare platforms in AnaChart vs TipRanks.
For institutional teams: AnaChart’s full analyst price-target and accuracy dataset — every analyst, every target and revision since 2004 — is available warehouse-native through AnaChart Corporate Access, delivered straight into Snowflake or Google BigQuery with no ETL.