
Contrarian Analysts Who Beat Consensus
Contrarian Analysts Who Beat Consensus
Introduction
Equity research often gravitates toward consensus. Analysts covering the same company typically evaluate similar earnings reports, management guidance, and industry data, which frequently results in clustered ratings and price targets across the research community.
However, some analysts publish views that diverge from prevailing expectations. These contrarian calls occur when an analyst issues a rating or price target that differs meaningfully from the broader consensus among analysts covering the same company.
Contrarian views do not always prove correct, but when supported by strong analysis, they can provide useful signals about changing market expectations. Examining situations where analysts diverge from consensus can offer insight into how sentiment evolves across the analyst community.
What Is a Contrarian Analyst Call?
A contrarian analyst call occurs when an analyst publishes a recommendation that differs materially from the dominant view among analysts covering a company.
Examples include:
- Maintaining a Hold or Sell rating while most analysts remain bullish
- Publishing a price target significantly higher or lower than consensus
- Issuing an upgrade before other analysts revise their outlooks
Contrarian calls often arise because analysts interpret company fundamentals, industry dynamics, or valuation assumptions differently from their peers. These differences can reflect varying expectations about growth trajectories, competitive positioning, or macroeconomic conditions.
Case Study: A Cautious View on Tesla
Differences in analyst outlooks can emerge even for widely followed companies such as Tesla.
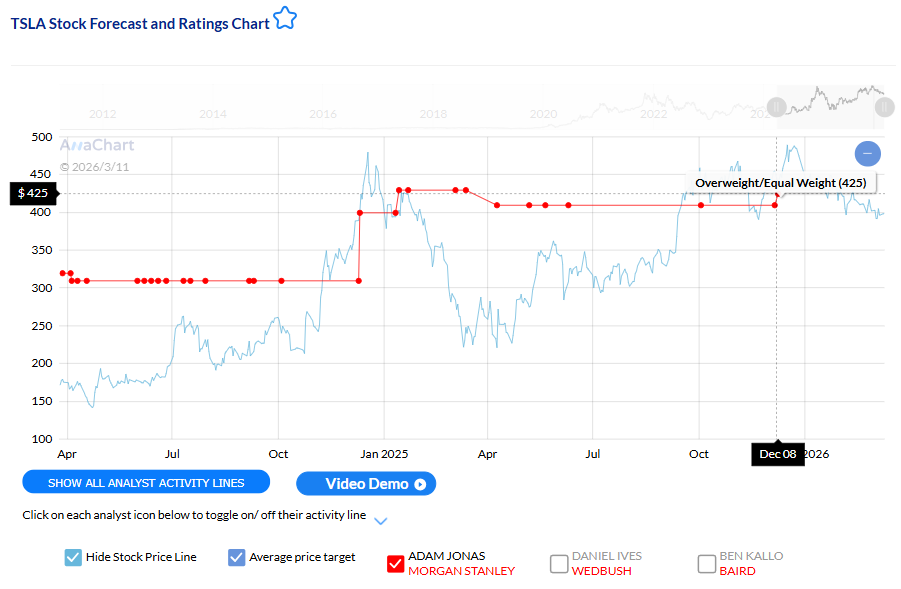
On December 8, 2025, Adam Jonas reiterated a Hold rating on Tesla with a $425 price target while the stock traded near $410.
At the time, the average analyst price target tracked by AnaChart was approximately $405.51, and nearly 67% of analysts maintained Buy ratings on the stock. Jonas’s Hold rating, therefore, represented a more cautious stance compared with the broader bullish sentiment surrounding Tesla at that point.
Historical analyst data compiled by AnaChart shows that Jonas has produced 181 successful predictions out of 204 tracked forecasts, representing an 88.73% success rate across 286 predictions. Analysts with strong track records sometimes diverge from consensus when their valuation assumptions differ from those of the broader analyst community.
Case Study: An Aggressive Price Target on Nvidia
Contrarian calls do not always take the form of caution. Sometimes an analyst publishes a price target significantly above consensus, reflecting a more optimistic view of a company’s prospects than the broader research community holds.
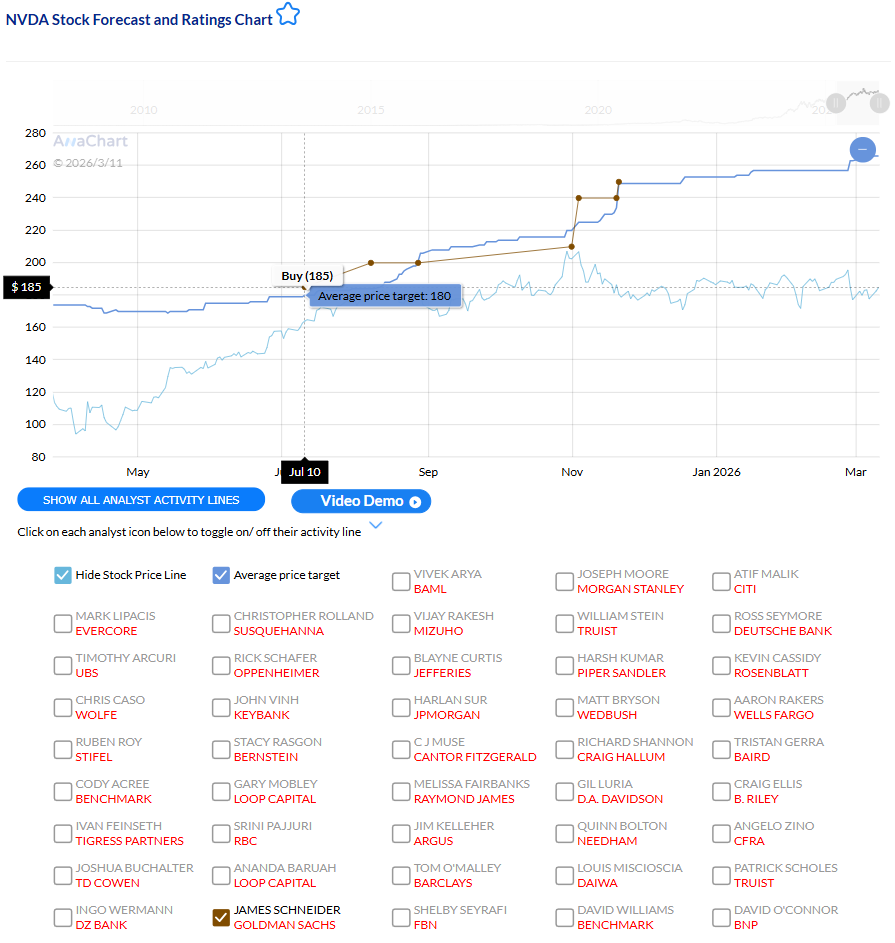
On July 10, 2025, James Schneider issued a Buy rating on Nvidia with a $250 price target while the stock traded near $240. At the time, the average analyst price target tracked by AnaChart stood near $180, making Schneider’s forecast $70 above the prevailing consensus among analysts covering the stock.
This type of divergence, where an analyst’s price target exceeds consensus by a meaningful margin, typically reflects different assumptions about the company’s long-term growth trajectory. In Nvidia’s case, the dispersion in analyst forecasts at the time reflected varying views on the pace of artificial-intelligence infrastructure investment and the durability of semiconductor demand cycles.
Sector Differences in Contrarian Calls
Contrarian calls do not appear equally across all industries. Some sectors naturally generate more disagreement among analysts due to higher uncertainty or rapidly evolving business models.
Technology
Technology companies often produce the widest range of analyst forecasts because their growth depends on rapidly evolving innovation cycles. Companies such as Nvidia or Tesla can generate widely varying assumptions about long-term adoption of emerging technologies, making contrarian calls more common in this sector.
Biotechnology
Biotech stocks frequently show large dispersion in analyst ratings due to binary events such as clinical trial outcomes or regulatory approvals. Analysts may interpret early scientific data very differently, creating conditions where contrarian views emerge more readily.
Utilities and Consumer Staples
In contrast, sectors with more stable revenue models, such as utilities or consumer staples, tend to show tighter clustering in analyst forecasts. Because earnings trajectories are generally more predictable, analysts often arrive at similar valuation estimates, leaving less room for meaningful contrarian divergence.
The Timing Edge of Contrarian Analysts
The value of a contrarian call often depends less on the disagreement itself and more on the timing. An analyst who publishes a divergent view ahead of a broader consensus shift provides more actionable information than one who simply maintains a minority position indefinitely.
When a contrarian analyst’s thesis later becomes more widely adopted, reflected in rating upgrades or price target revisions from other firms, the initial call is validated not only by the analyst’s accuracy but by the pace at which broader sentiment catches up.
This timing dimension is one reason that tracking analyst behavior historically is important. A single divergent call tells investors relatively little. A pattern of divergent calls that precede consensus shifts provides more meaningful evidence of an analyst’s ability to interpret emerging developments earlier than peers.
Identifying Contrarian Analysts Using AnaChart
Understanding which analysts consistently publish contrarian calls, and whether those calls prove accurate, requires access to historical analyst data across companies and time periods.
AnaChart aggregates analyst activity, allowing investors to examine:
- Individual analyst ratings and price target histories
- Consensus price target trends over time
- Historical prediction accuracy by analyst
- Divergence between individual forecasts and consensus estimates
By comparing individual analyst forecasts with consensus estimates at the time each call was made, investors can identify analysts whose views have historically diverged from the broader research community and evaluate whether those divergent calls have tended to prove accurate over time.
The case studies above illustrate how this type of analysis works in practice. AnaChart’s historical data makes it possible to examine not only what an analyst said but when they said it, relative to the broader consensus—the combination that ultimately determines whether a contrarian call provided genuine informational value.
Conclusion
Contrarian analyst calls remain an important element of the equity research ecosystem. While consensus estimates provide a useful benchmark for investor expectations, analysts who publish well-supported views that diverge from consensus can sometimes identify emerging trends earlier than the broader research community.
The case studies examined here illustrate how this dynamic can play out when individual analysts diverge from consensus ahead of broader shifts in market expectations.
The cases of Adam Jonas on Tesla and James Schneider on Nvidia illustrate how contrarian calls can take different forms: a cautious Hold amid broad bullishness, or an aggressive price target well above consensus. What both cases share is a meaningful divergence from the prevailing analyst view at the time the call was made.
By studying analyst track records and comparing individual forecasts with consensus expectations over time, investors can develop a clearer picture of which analysts have historically provided early and accurate signals. Platforms such as AnaChart make this type of historical analysis accessible, allowing investors to evaluate contrarian perspectives within the broader context of analyst performance data.
Related Reading
- When Top Analysts Disagree — What History Shows
- What Makes an Analyst Consistently Accurate?
- Right Too Late Is Wrong: The Case for Measuring Analyst Timing
🔍 See Real Analyst Track Records on AnaChart
AnaChart tracks 4,000+ Wall Street analysts — see their price target history, accuracy rate, and performance score for any stock.
Related on AnaChart: browse the top performing analysts by sector, and compare platforms in AnaChart vs TipRanks.
For institutional teams: AnaChart’s full analyst price-target and accuracy dataset — every analyst, every target and revision since 2004 — is available warehouse-native through AnaChart Corporate Access, delivered straight into Snowflake or Google BigQuery with no ETL.