
Seeking Alpha analyst ratings: the track record behind each one
By Mathew Auto, AnaChart research desk. Updated 23 October 2026. Data through 5 October 2026.
Seeking Alpha is where a lot of investors read the news on a stock. When an analyst upgrades Apple or cuts a target on Tesla, you can read about it there, next to a Wall Street rating that averages every analyst covering the stock.
What you don’t get there is the analyst’s history. Has this person been right on this stock before? How often were their past targets reached, and how long did it take? That’s the context AnaChart adds, and the two work best side by side.
Key findings
- 25 of 25targets reached for JPMorgan’s Richard Shane on SLM, the one Sell behind a Buy rating
- 0 of 9for Gordon Johnson‘s Tesla targets. His $24.86 Sell sits inside the average
- 66 of 66for Laura Martin on Apple, rated Hold
- 7 of 7for Nat Schindler on Meta, in 35 days on average
- 0 of 4so far for the analyst behind Nvidia’s $515 high target
In this post
What Seeking Alpha’s analyst rating shows
Each stock on Seeking Alpha has three ratings. The Wall Street rating averages the bank and broker analysts on a scale from 1 (Strong Sell) to 5 (Strong Buy).
SA Authors is an average of the writers who publish on the site, and Quant is Seeking Alpha’s own model score. Its help center says the Wall Street data comes from third-party sources.
On the free page for each stock you see the average rating, how many ratings fall in each bucket from Strong Buy to Strong Sell over the last 90 days, and an average, high and low price target with a chart.
Part of the page sits behind a Premium prompt. We haven’t checked what Premium shows analyst by analyst.
For keeping up with a stock, that’s a lot of useful information in one place.
The context it leaves out
An average rating treats every analyst the same. A Buy from someone whose last 50 targets on the stock were all reached counts exactly as much as a Buy from someone who has never been right on it.
The news has the same gap. A headline says an analyst raised a target. It doesn’t say whether that analyst’s targets on the stock tend to be reached, or how long they usually take.
Over the next year, a raise and a cut have been followed by almost the same share price moves, as we found in 267,985 target revisions.
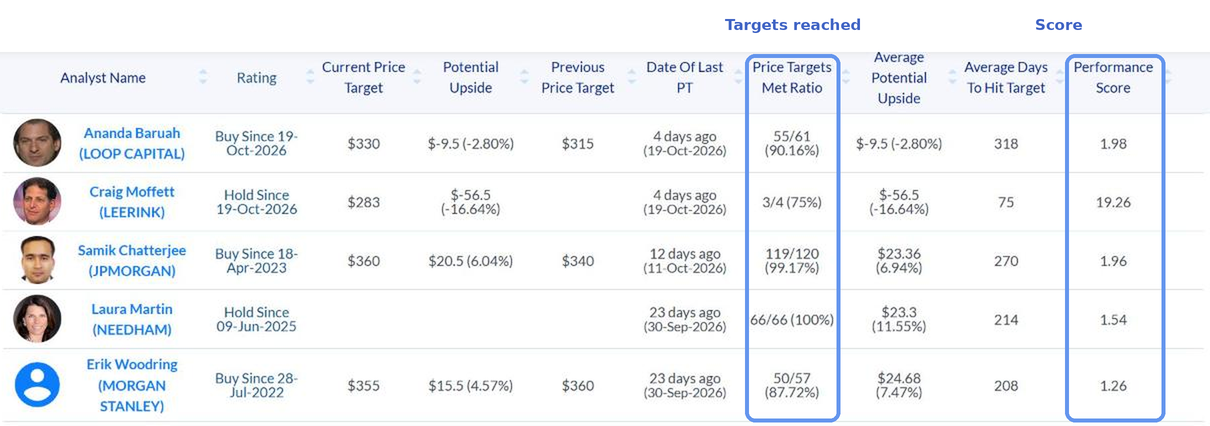
AnaChart fills that gap. Every stock page lists each analyst by name with their current rating and target, how many of their past targets on that stock were reached, the average number of days it took and a performance score.
That’s the record behind the rating.
Key takeaway: the rating tells you what the Street thinks. The record tells you whose view has held up.
Five stocks: the rating, then the analysts behind it
We took five stocks on 23 October 2026, noted the Wall Street rating on Seeking Alpha’s free page, then opened the same stock on AnaChart.
Apple: a Buy rating, and very different track records
Seeking Alpha’s rating on Apple was 3.75, a Buy, with six Sell or Strong Sell ratings in the mix. The average target was below the $348.22 share price.
On AnaChart, the lowest target, $245, belongs to Tim Long of Barclays, who rates Apple a Sell. 53 of his 82 past Apple targets were reached. At the top, Dan Ives of Wedbush has $400, with 205 of 220 reached, and Krish Sankar of TD Cowen has $400 with 51 of 54.
Samik Chatterjee of JPMorgan, at $360, has had 119 of 120 reached. Laura Martin of Needham rates Apple a Hold, and all 66 of her past Apple targets were reached.
Tesla: the Sell that has never been reached
Seeking Alpha’s rating on Tesla was 3.63, a Buy, with 21 Holds and four Sell or Strong Sell ratings.
On AnaChart, Gordon Johnson of GLJ Research has rated Tesla a Sell since August 2018, and his target is $24.86 against a $374.58 price. None of his 9 past Tesla targets were reached.
Dan Ives of Wedbush holds the $600 high, with 76 of 106 reached. Ben Kallo of Baird, at $522, has 166 of 175. The best performance score on the page is Pierre Ferragu‘s at New Street Research: 22 of 25 reached, with a $465 target.
Nvidia: the highest target comes with no hits yet
Seeking Alpha’s rating on Nvidia was 4.70, a Strong Buy, with a high target of $515.
On AnaChart, that $515 is Simon Leopold‘s at Raymond James, about 2.4 times the $212.21 price, and none of his 4 earlier Nvidia targets have been reached so far. Mark Lipacis of Evercore, at $465, has had 62 of 66 reached.
Christopher Rolland of Susquehanna has the most cautious Buy target set this year, $230, with 59 of 62 reached. Ross Seymore of Deutsche Bank rates it a Hold at $255. His targets were reached 39 times out of 53, in 77 days on average.
Meta: from $640 to $1,000 in ten weeks
Seeking Alpha’s rating on Meta was 4.60, a Strong Buy.
Behind it, Ken Gawrelski of Wells Fargo cut his target from $835 to $640 on 30 July 2026, then raised it to $1,000 on 5 October. On AnaChart that’s one analyst’s history you can click through, with 29 of his 39 past Meta targets reached.
The lowest target, $595, is Scott Devitt‘s at Wedbush, with 45 of 49 reached. Nat Schindler of Scotiabank rates Meta a Hold at $700. All 7 of his past Meta targets were reached, in 35 days on average.
SLM: one Sell, with a perfect record
Seeking Alpha’s rating on SLM was 4.00, a Buy, with a single Sell among 11 ratings.
On AnaChart, that Sell is Richard Shane’s at JPMorgan, with a $22 target close to the $22.83 price.
All 25 of his past SLM targets were reached, in 132 days on average. Terry Ma of Barclays rates it a Buy at $26, with 2 of 4 reached so far.
Does that mean you should just follow the analyst with the best record? Not always.
On the share price a year out, the plain average beat the best-record analyst more often than not in our test of 8,537 cases. The record matters most when you’re judging a single call.
The five stocks in one table
| Stock | Seeking Alpha rating | One analyst behind it, from AnaChart | Their record on the stock |
|---|---|---|---|
| Apple | 3.75 Buy | Laura Martin, Needham: Hold | 66 of 66 reached |
| Tesla | 3.63 Buy | Gordon Johnson, GLJ: Sell, $24.86 | 0 of 9 reached |
| Nvidia | 4.70 Strong Buy | Simon Leopold, Raymond James: $515 | 0 of 4 reached so far |
| Meta | 4.60 Strong Buy | Nat Schindler, Scotiabank: Hold, $700 | 7 of 7 reached, 35 days on average |
| SLM | 4.00 Buy | Richard Shane, JPMorgan: Sell, $22 | 25 of 25 reached |
On a phone, swipe the table sideways to see every column.
Seeking Alpha ratings from its free sell-side ratings pages, AnaChart records from its stock pages, both on 23 October 2026.
Key takeaway: on all five stocks, analysts with very different records sit behind the same average.
How to use the two together
- Read the story on Seeking Alpha. If it’s an upgrade, a downgrade or a new target, note the analyst’s name.
- Open the stock on AnaChart and find that analyst. Check how many of their past targets on the stock were reached and how long they took.
- Look at who sits at the top and bottom of the target range. The extremes often come from analysts with very different records.
- If you want one number to sort by, use the performance score. It rewards targets that were reached, how far they were from the price and how fast they got there.
For how often analyst targets are reached across the market, see how accurate analyst price targets are. We’ve also looked at how AnaChart fits next to StockAnalysis and TipRanks.
Open any stock on AnaChart to see every analyst’s target and how their past targets on that stock turned out. Try AAPL or TSLA. Full access is on anachart.store.
Seeking Alpha ratings checked on its free pages on 23 October 2026. AnaChart records as shown on its stock pages that day. Published 23 October 2026.
Mathew Auto is the byline of AnaChart’s research desk. Articles under this name are written by the AnaChart team from AnaChart’s record of 661,383 analyst price targets and 759,654 ratings, and every figure is checked against that record before it’s published.
Frequently asked questions
Is Seeking Alpha’s analyst data reliable?
Its Wall Street rating is an average of sell-side ratings, which its help center says come from third-party data providers. It’s a fair read of current opinion. It doesn’t show how each analyst’s past targets on the stock turned out, which is what AnaChart adds.
Does Seeking Alpha show analyst track records?
Its free pages show the average rating, the split from Strong Buy to Strong Sell and an average, high and low target, without naming the analysts. We haven’t checked what a Premium account shows.
How do I check an analyst’s past performance on a stock?
Open the stock on AnaChart. Each analyst is listed with their past targets reached, the average days to reach them and a performance score. On Apple, for example, Laura Martin of Needham has had all 66 of her past targets reached.
What is the difference between SA Authors, Quant and Wall Street ratings?
Wall Street ratings come from bank and broker analysts. SA Author ratings come from writers on Seeking Alpha. Quant is Seeking Alpha’s own model score for the stock.