Tag: stock analysts

Top NVIDIA (NVDA) Analysts — Who Gets the Price Targets Right?

Top NVIDIA (NVDA) Analysts — Who Gets the Price Targets Right?

NVIDIA (NVDA) is one of the most covered — and most debated — stocks on Wall Street. With its dominant position in AI chips and data center infrastructure, NVDA analyst price targets can swing dramatically. But not all analyst calls are created equal.

AnaChart tracks every analyst who has ever covered NVIDIA, showing their complete price target history, accuracy rate, and performance score. Here’s what the data shows about who gets NVDA right.

Why NVDA Analyst Coverage Is Uniquely Challenging

NVIDIA’s valuation is highly sensitive to AI spending cycles, making price target accuracy harder than average. Analysts who successfully called NVDA’s explosive run from 2023 onwards had to correctly anticipate both the AI infrastructure buildout and NVIDIA’s competitive moat — a combination that tripped up many on Wall Street.

How to Evaluate NVDA Analysts

When reviewing NVIDIA analyst coverage, look for three key metrics:

  • Price target hit ratio — What percentage of their NVDA price targets were actually reached within 12 months?
  • Average days to target — Did they call moves early enough to be actionable?
  • Rating consistency — Did they maintain conviction during volatility, or flip-flop with market sentiment?

What AnaChart Shows About NVDA Analyst Performance

AnaChart’s database contains thousands of NVIDIA price targets going back years, allowing you to see the full track record of every analyst covering the stock — not just their most recent call.

You can view the consensus price target, see which analysts are most bullish vs. most conservative, and filter by performance score to find the analysts who have historically been most accurate on NVDA specifically.

Explore NVDA Analyst Data on AnaChart

Ready to see which analysts have the best track record on NVIDIA? AnaChart lets you compare all active NVDA analysts side by side, with full price target history and accuracy statistics.

See All NVDA Analyst Price Targets on AnaChart

Compare 4,000+ Wall Street analyst track records. Filter by accuracy, timing, and performance score.

View NVDA Analysts on AnaChart →

Related Reading

Contrarian Analysts Who Beat Consensus

Contrarian Analysts Who Beat Consensus

Contrarian Analysts Who Beat Consensus

Introduction

Equity research often gravitates toward consensus. Analysts covering the same company typically evaluate similar earnings reports, management guidance, and industry data, which frequently results in clustered ratings and price targets across the research community.

However, some analysts publish views that diverge from prevailing expectations. These contrarian calls occur when an analyst issues a rating or price target that differs meaningfully from the broader consensus among analysts covering the same company.

Contrarian views do not always prove correct, but when supported by strong analysis, they can provide useful signals about changing market expectations. Examining situations where analysts diverge from consensus can offer insight into how sentiment evolves across the analyst community.

What Is a Contrarian Analyst Call?

A contrarian analyst call occurs when an analyst publishes a recommendation that differs materially from the dominant view among analysts covering a company.

Examples include:

  • Maintaining a Hold or Sell rating while most analysts remain bullish 
  • Publishing a price target significantly higher or lower than consensus 
  • Issuing an upgrade before other analysts revise their outlooks

Contrarian calls often arise because analysts interpret company fundamentals, industry dynamics, or valuation assumptions differently from their peers. These differences can reflect varying expectations about growth trajectories, competitive positioning, or macroeconomic conditions.

Case Study: A Cautious View on Tesla

Differences in analyst outlooks can emerge even for widely followed companies such as Tesla.

On December 8, 2025, Adam Jonas reiterated a Hold rating on Tesla with a $425 price target while the stock traded near $410.

At the time, the average analyst price target tracked by AnaChart was approximately $405.51, and nearly 67% of analysts maintained Buy ratings on the stock. Jonas’s Hold rating, therefore, represented a more cautious stance compared with the broader bullish sentiment surrounding Tesla at that point.

Historical analyst data compiled by AnaChart shows that Jonas has produced 181 successful predictions out of 204 tracked forecasts, representing an 88.73% success rate across 286 predictions. Analysts with strong track records sometimes diverge from consensus when their valuation assumptions differ from those of the broader analyst community.

Adam Jonas (Morgan Stanley) Tesla analyst performance on AnaChart — contrarian vs consensus

Case Study: An Aggressive Price Target on Nvidia

Contrarian calls do not always take the form of caution. Sometimes an analyst publishes a price target significantly above consensus, reflecting a more optimistic view of a company’s prospects than the broader research community holds.

On July 10, 2025, James Schneider issued a Buy rating on Nvidia with a $250 price target while the stock traded near $240. At the time, the average analyst price target tracked by AnaChart stood near $180, making Schneider’s forecast $70 above the prevailing consensus among analysts covering the stock.

This type of divergence, where an analyst’s price target exceeds consensus by a meaningful margin, typically reflects different assumptions about the company’s long-term growth trajectory. In Nvidia’s case, the dispersion in analyst forecasts at the time reflected varying views on the pace of artificial-intelligence infrastructure investment and the durability of semiconductor demand cycles.

James Schneider NVDA analyst performance on AnaChart — contrarian accuracy tracking

Sector Differences in Contrarian Calls

Contrarian calls do not appear equally across all industries. Some sectors naturally generate more disagreement among analysts due to higher uncertainty or rapidly evolving business models.

Technology

Technology companies often produce the widest range of analyst forecasts because their growth depends on rapidly evolving innovation cycles. Companies such as Nvidia or Tesla can generate widely varying assumptions about long-term adoption of emerging technologies, making contrarian calls more common in this sector.

Biotechnology

Biotech stocks frequently show large dispersion in analyst ratings due to binary events such as clinical trial outcomes or regulatory approvals. Analysts may interpret early scientific data very differently, creating conditions where contrarian views emerge more readily.

Utilities and Consumer Staples

In contrast, sectors with more stable revenue models, such as utilities or consumer staples, tend to show tighter clustering in analyst forecasts. Because earnings trajectories are generally more predictable, analysts often arrive at similar valuation estimates, leaving less room for meaningful contrarian divergence.

The Timing Edge of Contrarian Analysts

The value of a contrarian call often depends less on the disagreement itself and more on the timing. An analyst who publishes a divergent view ahead of a broader consensus shift provides more actionable information than one who simply maintains a minority position indefinitely.

When a contrarian analyst’s thesis later becomes more widely adopted, reflected in rating upgrades or price target revisions from other firms, the initial call is validated not only by the analyst’s accuracy but by the pace at which broader sentiment catches up.

This timing dimension is one reason that tracking analyst behavior historically is important. A single divergent call tells investors relatively little. A pattern of divergent calls that precede consensus shifts provides more meaningful evidence of an analyst’s ability to interpret emerging developments earlier than peers.

Identifying Contrarian Analysts Using AnaChart

Understanding which analysts consistently publish contrarian calls, and whether those calls prove accurate, requires access to historical analyst data across companies and time periods.

AnaChart aggregates analyst activity, allowing investors to examine:

  • Individual analyst ratings and price target histories 
  • Consensus price target trends over time 
  • Historical prediction accuracy by analyst 
  • Divergence between individual forecasts and consensus estimates 

By comparing individual analyst forecasts with consensus estimates at the time each call was made, investors can identify analysts whose views have historically diverged from the broader research community and evaluate whether those divergent calls have tended to prove accurate over time.

The case studies above illustrate how this type of analysis works in practice. AnaChart’s historical data makes it possible to examine not only what an analyst said but when they said it, relative to the broader consensus—the combination that ultimately determines whether a contrarian call provided genuine informational value.


Conclusion

Contrarian analyst calls remain an important element of the equity research ecosystem. While consensus estimates provide a useful benchmark for investor expectations, analysts who publish well-supported views that diverge from consensus can sometimes identify emerging trends earlier than the broader research community.

The case studies examined here illustrate how this dynamic can play out when individual analysts diverge from consensus ahead of broader shifts in market expectations.

The cases of Adam Jonas on Tesla and James Schneider on Nvidia illustrate how contrarian calls can take different forms: a cautious Hold amid broad bullishness, or an aggressive price target well above consensus. What both cases share is a meaningful divergence from the prevailing analyst view at the time the call was made.

By studying analyst track records and comparing individual forecasts with consensus expectations over time, investors can develop a clearer picture of which analysts have historically provided early and accurate signals. Platforms such as AnaChart make this type of historical analysis accessible, allowing investors to evaluate contrarian perspectives within the broader context of analyst performance data.


Related Reading

🔍 See Real Analyst Track Records on AnaChart

AnaChart tracks 4,000+ Wall Street analysts — see their price target history, accuracy rate, and performance score for any stock.

Explore AnaChart Free →

AnaChart Recognizes Top Analysts’ Performance in 2025

AnaChart Recognizes Top Analysts’ Performance in 2025

By: Michael Muchugia

(Jan. 16, 2026, New York City) — Today, AnaChart.com, a New York–based fintech company that tracks sell-side stock analysts’ stock picks, identified the top research analysts whose stock recommendations outperformed during 2025. These analysts were selected based on the strength, timing, and consistency of their research as measured against realized stock performance throughout the year.

AnaChart’s proprietary algorithm evaluates each analyst’s published recommendations and related price returns across all stocks they cover. The analysis emphasizes price-target timing, conviction, and follow-through, highlighting analysts whose research demonstrated effective price discovery rather than reactive adjustments.

During 2025, several of the top-performing analyst calls were concentrated in technology, semiconductors, aerospace, materials, financial technology, and media, reflecting major inflection points across AI infrastructure, space commercialization, commodities, and corporate turnarounds. AnaChart tracked how analyst forecasts evolved ahead of and during these stock moves.

AnaChart CEO Joseph Kalish commented,

“While equity markets delivered strong gains in 2025, a number of sell-side analysts materially outperformed broad benchmarks through disciplined stock selection and timely research updates. AnaChart’s data allows investors to identify analysts whose price targets consistently led realized returns.”

Top Analysts of 2025

Top Picks

Colin Canfield (Cantor Fitzgerald) – Technology / Space Communications*

Top Pick: AST SpaceMobile (ASTS)

AnaChart Current Performance Score: 21.29

Colin Canfield’s coverage of AST SpaceMobile stood out in 2025 due to disciplined price-target increases that preceded the stock’s most significant phase of appreciation. His targets consistently led price during ASTS’s major upside move, reflecting effective price discovery and superior performance relative to peers.

His coverage aligned with widely reported discussions around AST SpaceMobile’s satellite deployment milestones and commercialization timeline during 2025.

Ed Engel (Compass Point) – Financial Services*

Top Pick: Robinhood Markets (HOOD)

AnaChart Current Performance Score: 19.89

Ed Engel’s coverage of Robinhood Markets ranked highest in 2025 due to timely price-target revisions that consistently led major price advances. His forecasts anticipated HOOD’s breakout phase and tracked the stock’s upward re-rating with disciplined, forward-looking adjustments.

His research aligned with broader public commentary around improving trading activity and operating leverage at Robinhood during 2025.


Christopher Rolland (Susquehanna) – Technology

Top Pick: Lumentum Holdings (LITE)

AnaChart Current Performance Score: 5.41

Josh Wolfson (RBC) – Materials

Top Pick: AngloGold Ashanti (AU)

AnaChart Current Performance Score: 9.09


Mark Newman (Bernstein) – Semiconductors

Top Pick: Micron Technology (MU)

AnaChart Current Performance Score: 5.6


Laurence Alexander (Jefferies) – Materials & Industrials

Top Pick: MP Materials (MP)

AnaChart Current Performance Score: 6.24


Asiya Merchant– Technology Hardware

Top Pick: Western Digital (WDC)

AnaChart Current Performance Score: 5.58

Ryan Koontz (Needham) – Technology & Networking

Top Pick: Ciena (CIEN)

AnaChart Current Performance Score: 6.88

Jason Gursky (Citi) – Aerospace & Defense

Top Pick: Rocket Lab (RKLB)

AnaChart Current Performance Score: 18.68


Kannan Venkateshwar (Barclays) – Media & Entertainment

Top Pick: Warner Bros. Discovery (WBD)

AnaChart Current Performance Score: 5.42


Honorable Mentions

Melissa Fairbanks (Raymond James) – Semiconductors

Top Pick: Micron Technology (MU)

AnaChart Current Performance Score: 12.19

James Yaro (Goldman Sachs) – Financial Technology

Top Pick: Robinhood Markets (HOOD)

AnaChart Current Performance Score: 19.24

Short of the Year (2025)

Brooke Roach (Goldman Sachs) – Consumer Discretionary
Short / Avoidance Pick: Deckers Outdoor (DECK)

Throughout 2025, Deckers Outdoor experienced a sharp drawdown following its prior period of strength. During this decline, Brooke Roach maintained price targets that remained below the prevailing stock price, avoiding participation in temporary rebounds and demonstrating valuation discipline. Her restrained approach contrasted with broader market optimism and proved effective as DECK continued to re-rate lower. 

About AnaChart

AnaChart.com is revolutionizing the fintech industry as an equity research support platform. Founded in 2020, AnaChart uses proprietary technology to track up-to-date price targets and ratings published by top sell-side stock analysts. The platform provides transparency into analyst performance, helping investors better understand which research has historically added value. AnaChart offers a free version covering analyst picks on leading U.S. equities, as well as a subscription service tracking thousands of stocks and analysts globally.

For further information, contact [email protected].

Related Reading

Annual Top Analysts Series:
2022 | 2023 | 2024 | 2025

🔍 See Real Analyst Track Records on AnaChart

AnaChart tracks 4,000+ Wall Street analysts — see their price target history, accuracy rate, and performance score for any stock.

Explore AnaChart Free →

AnaChart vs WallStreetZen: Which Analyst Research Platform Gives You the Full Picture?

AnaChart vs WallStreetZen: Which Analyst Research Platform Gives You the Full Picture?

By: Michael Muchugia

For more than 50 years, Wall Street analysts have played a central role in shaping how investors understand markets, companies, and valuation expectations. Their ratings, price targets, and revisions influence institutional decision-making and often guide retail investors seeking professional insight.

However, one reality remains constant: not all analysts perform equally, and not all research platforms surface those differences clearly. Some analysts anticipate price movements before they happen, while others revise their views only after prices have already moved. Understanding this distinction — and having access to the data that reveals it — can materially affect how analyst research is interpreted and used.

This is why choosing the right research platform matters. This article compares AnaChart vs WallStreetZen, two platforms designed to support investors who rely on professional analyst research, but which approach analyst data in fundamentally different ways.

What Is WallStreetZen to Wall Street Analysts?

WallStreetZen is a stock research platform built around simplification and accessibility. Its core product is the Zen Ratings system, a quantitative model that evaluates stocks using approximately 115 proprietary factors, combining financial metrics, forecasts, and performance indicators into a single composite score.

In addition to its quantitative framework, WallStreetZen aggregates analyst sentiment across thousands of analysts covering U.S. equities. Rather than emphasizing individual analyst behavior, the platform presents consensus-level signals, summary ratings, and model-driven forecasts designed to help users quickly assess whether a stock appears attractive relative to the broader market.

WallStreetZen describes its primary audience as serious part-time investors — users who want structured guidance without having to manually analyze individual analyst histories or revisions. As a result, analyst insights are largely distilled into aggregated indicators and forecast checks, rather than displayed at the analyst-by-analyst level.


Why You Should Consider AnaChart as an Alternative to WallStreetZen

AnaChart was built with a different philosophy.

Where WallStreetZen assigns one general performance profile per analyst, AnaChart evaluates analyst performance on a per-stock basis. If an analyst covers 15 different stocks, AnaChart tracks and scores their historical accuracy separately for each of those stocks, rather than compressing all outcomes into a single reputation score.

This distinction raises an important question for investors:

Does a general analyst ranking provide enough confidence to trade a specific stock, or do you want to know how that analyst has actually performed on the stock you’re evaluating?

AnaChart also places greater emphasis on price targets rather than categorical ratings. Price targets are numerical, measurable, and directly comparable to actual price outcomes. Ratings such as Buy, Hold, or Sell are subjective and can vary significantly between firms and analysts, making them harder to evaluate consistently over time.

By focusing on price targets and revisions, AnaChart enables investors to examine not just what analysts say, but when they say it relative to market movement.

What to Look for in an Alternative to WallStreetZen

For investors who rely heavily on professional analyst research, data depth and historical context matter.

AnaChart provides access to over 700,000 historical analyst price targets, spanning more than 15 years of market history. This allows users to study how analyst expectations evolve across different market cycles, volatility regimes, and macro environments.

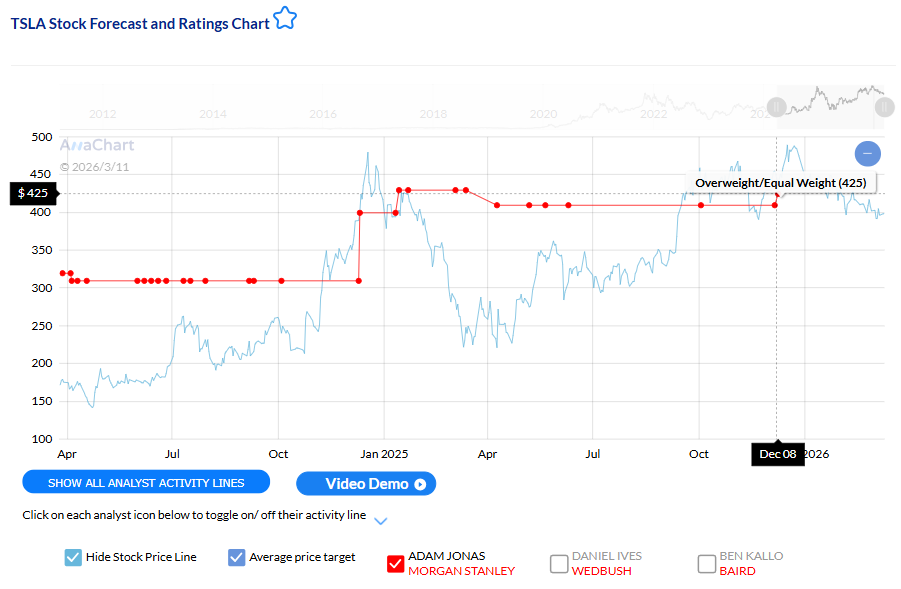
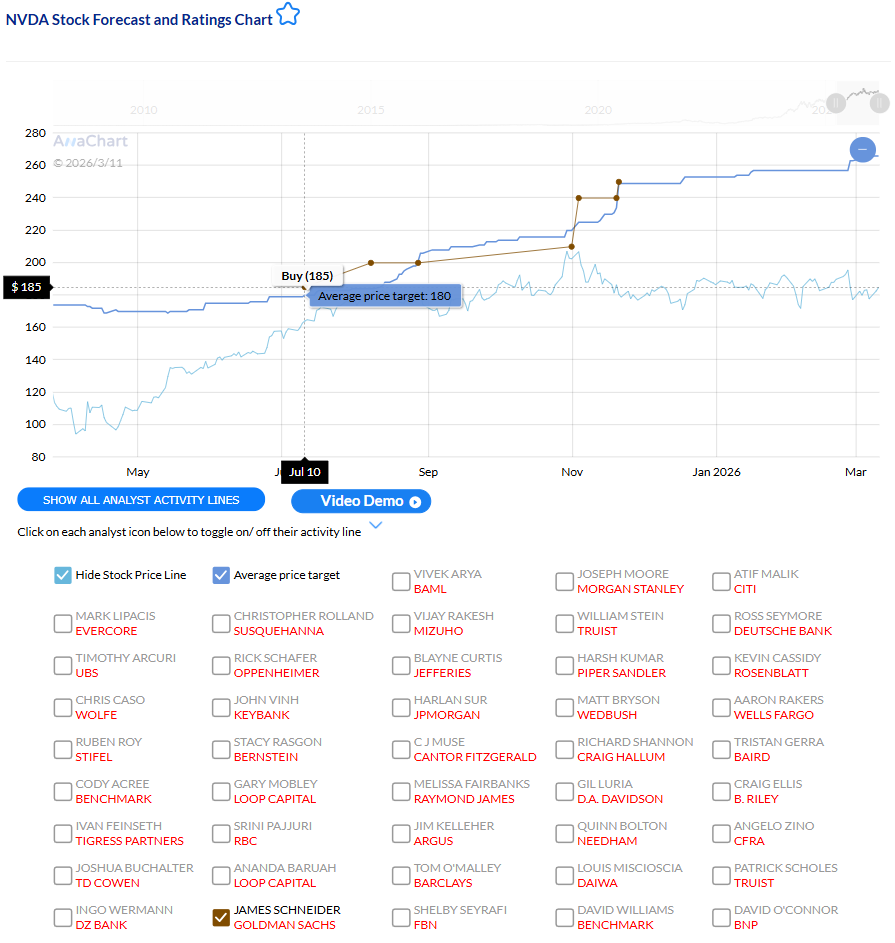
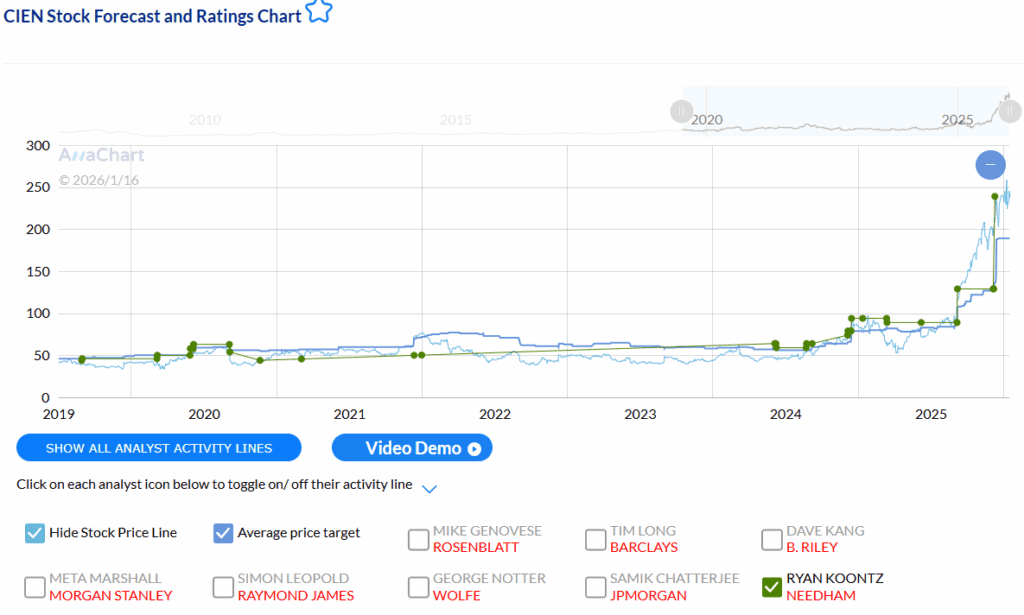
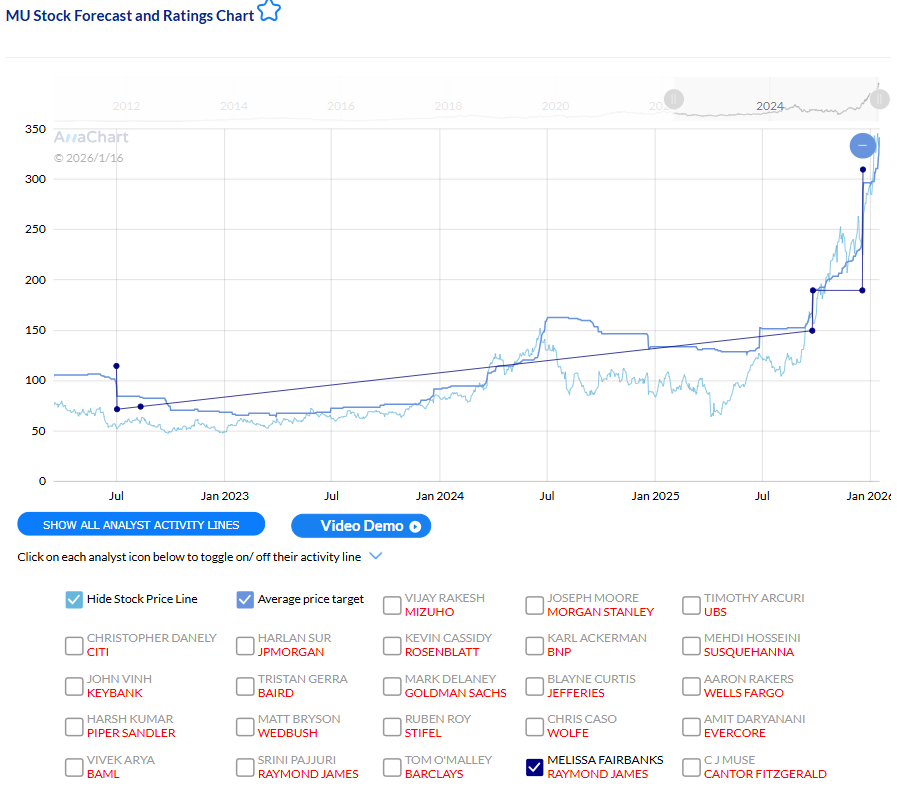
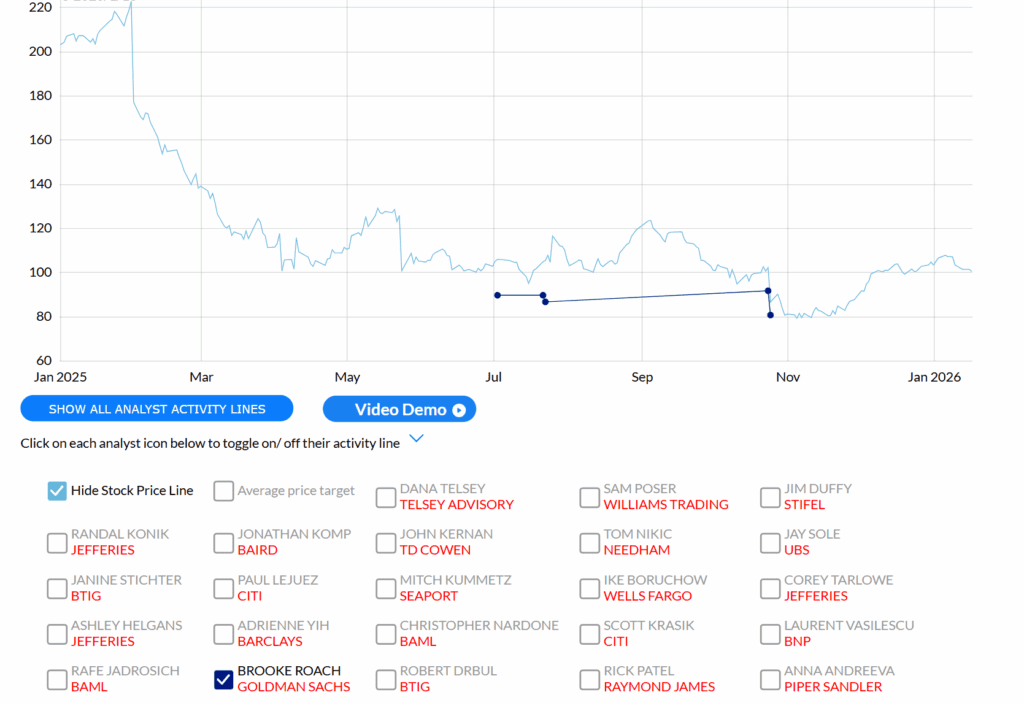
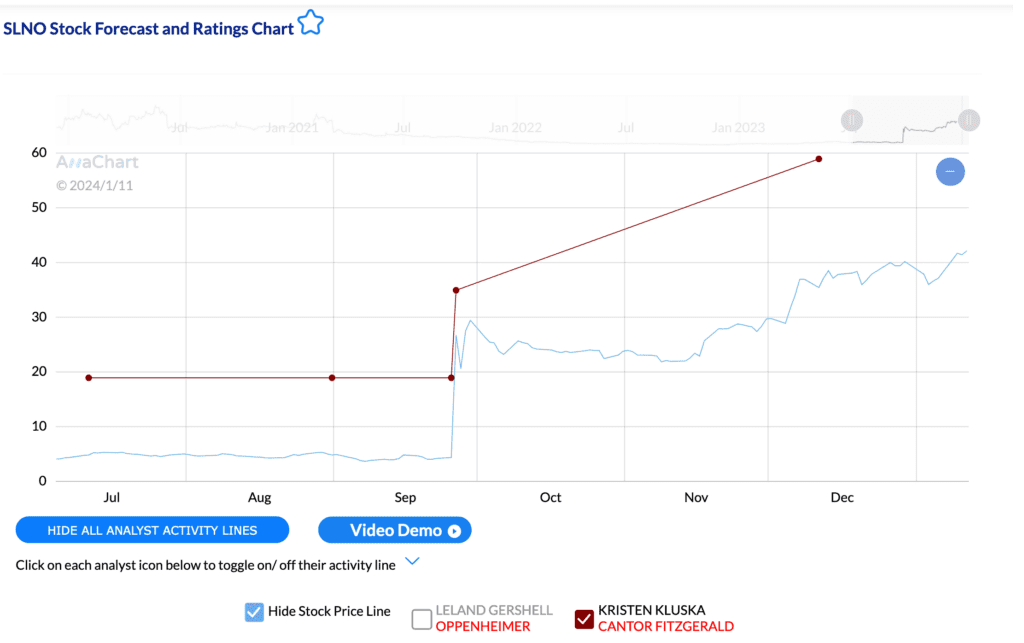
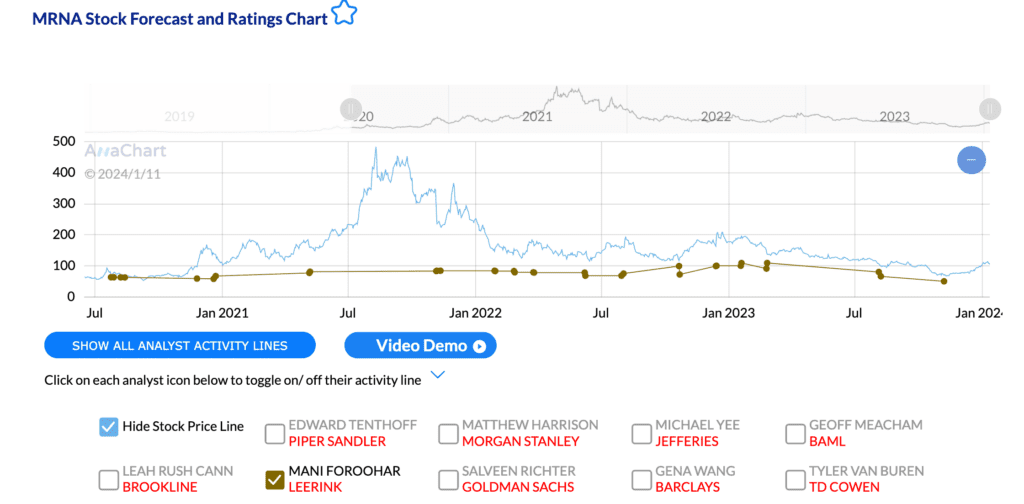
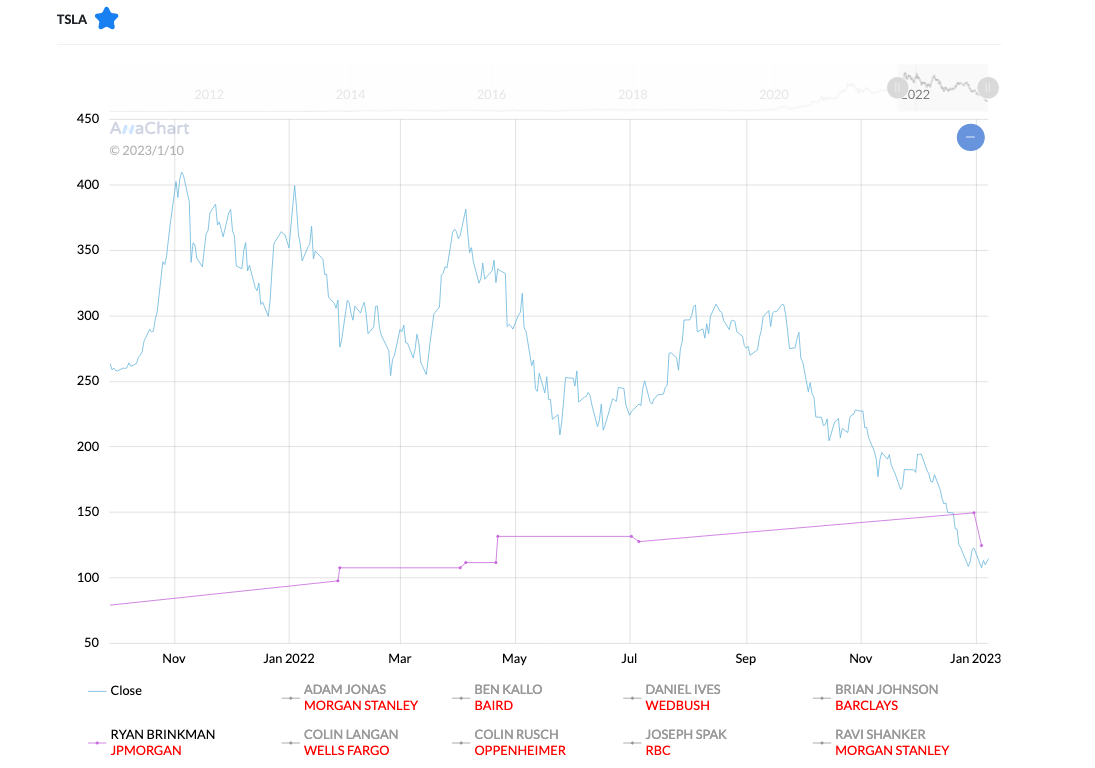
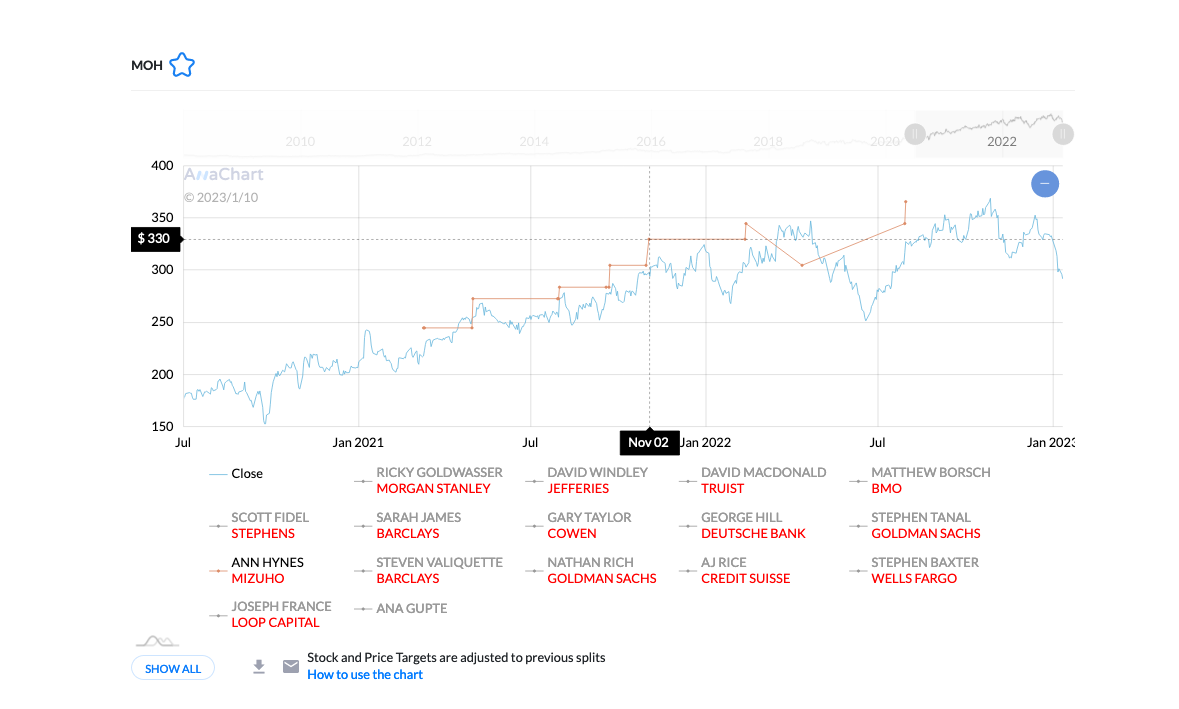
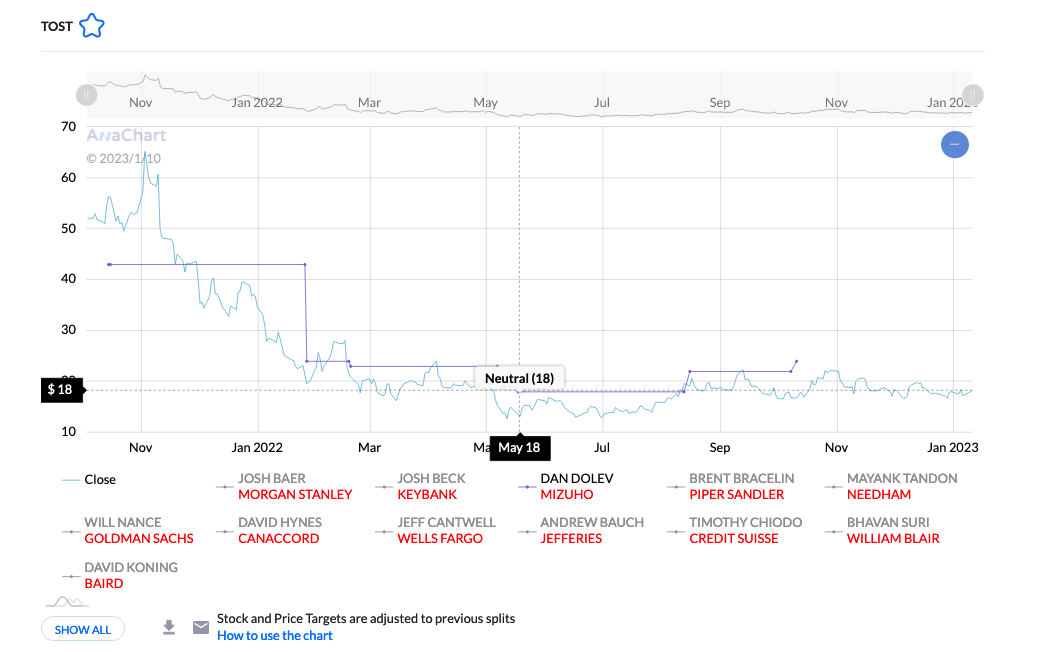
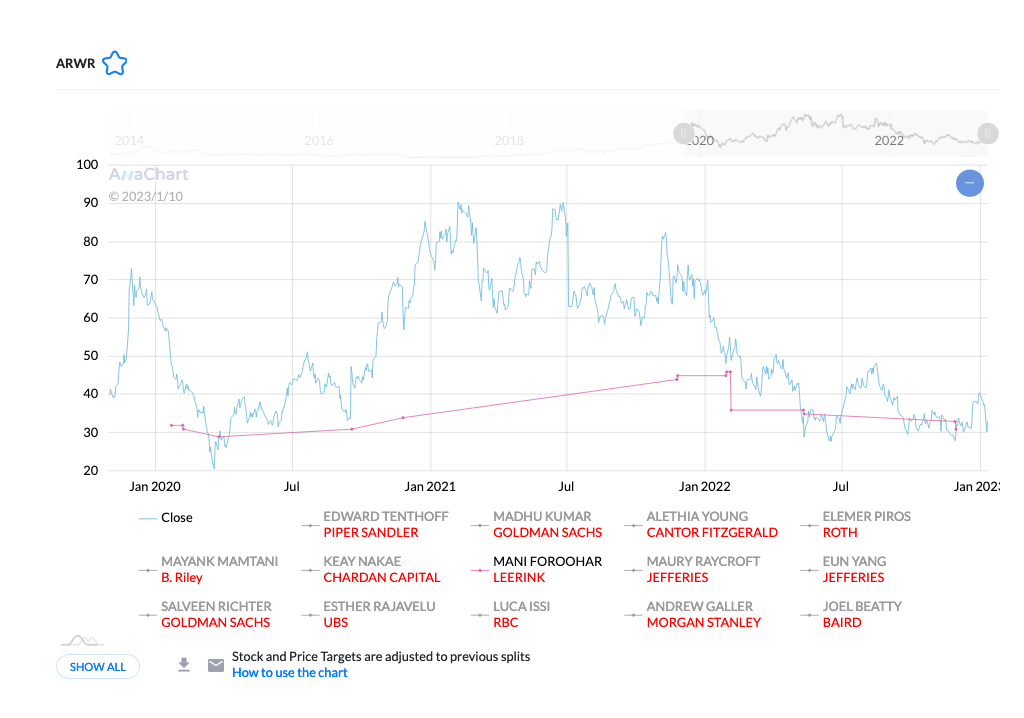
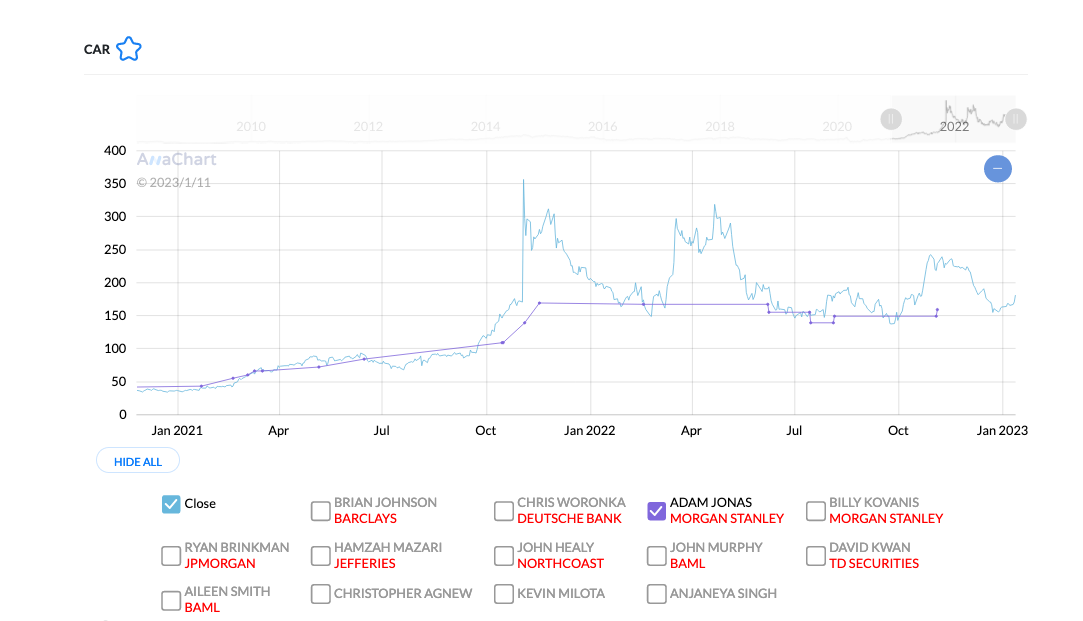
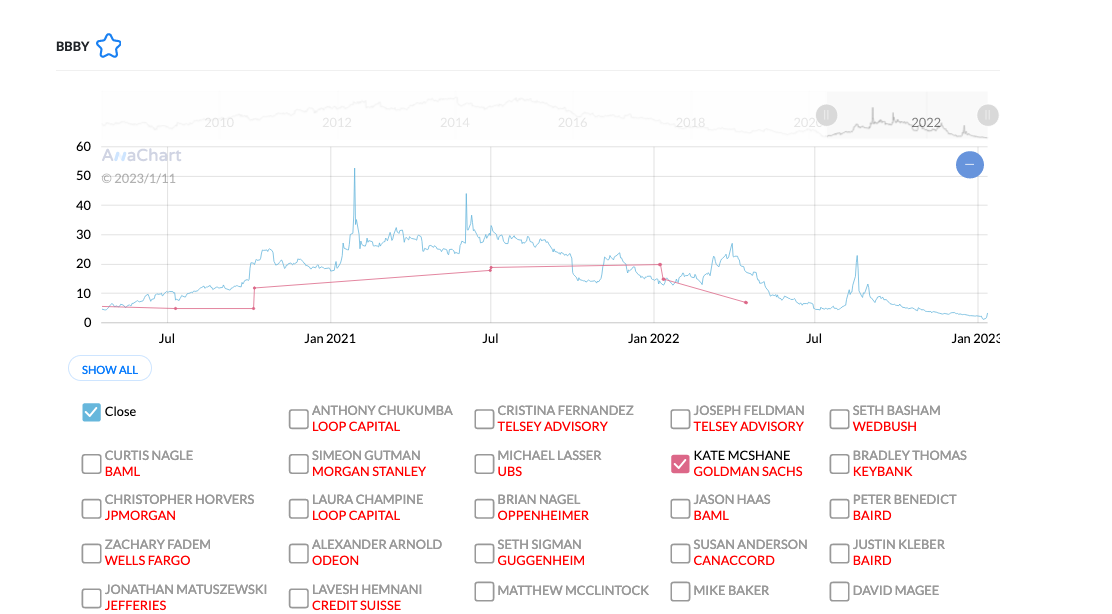
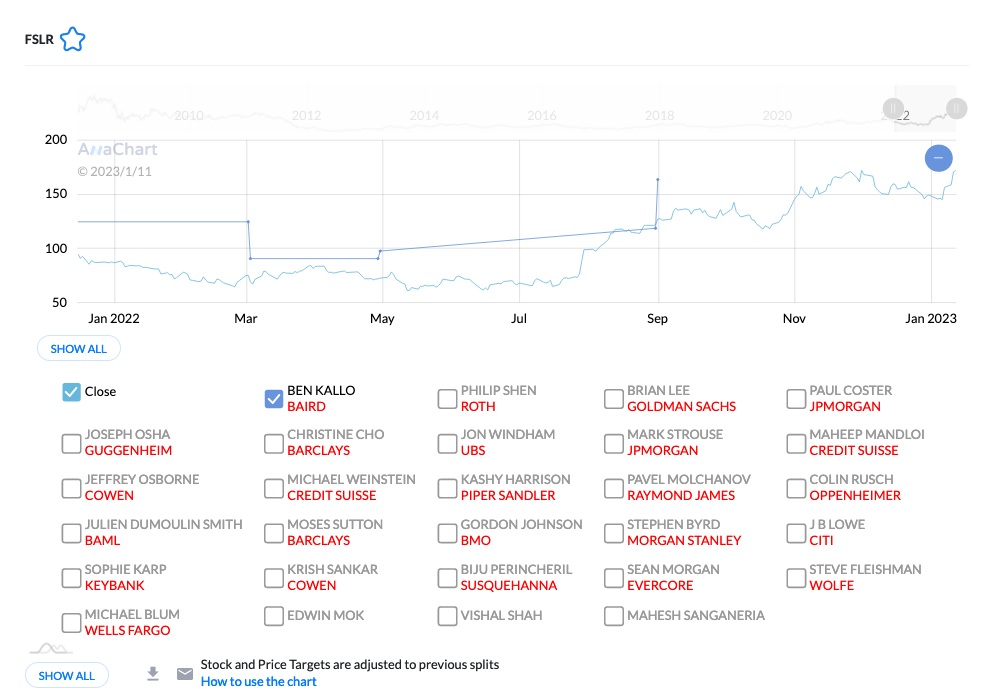
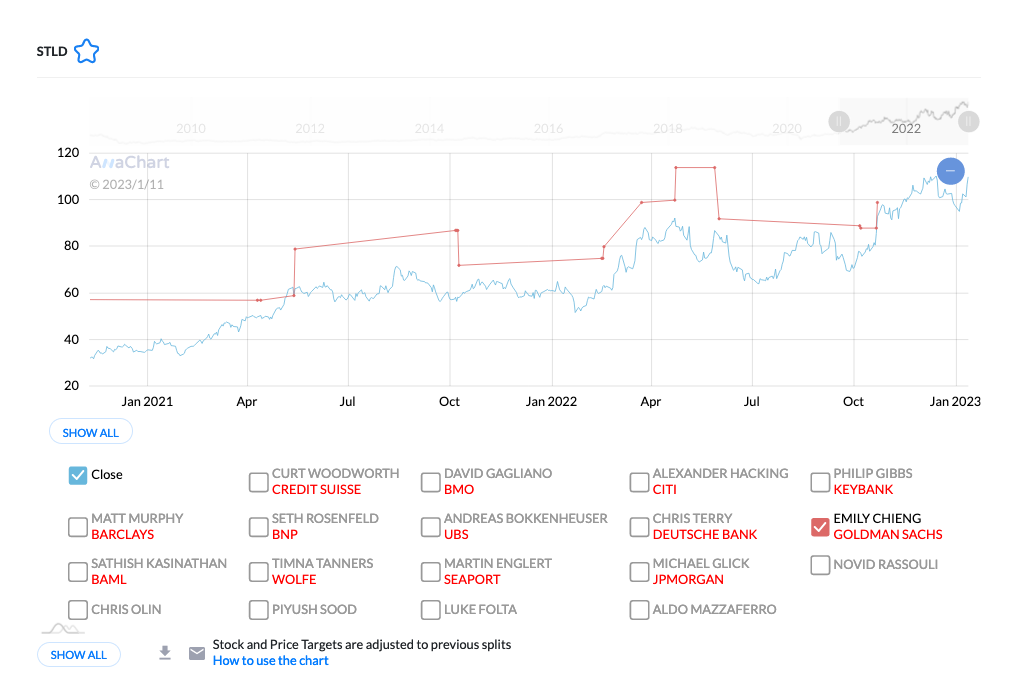
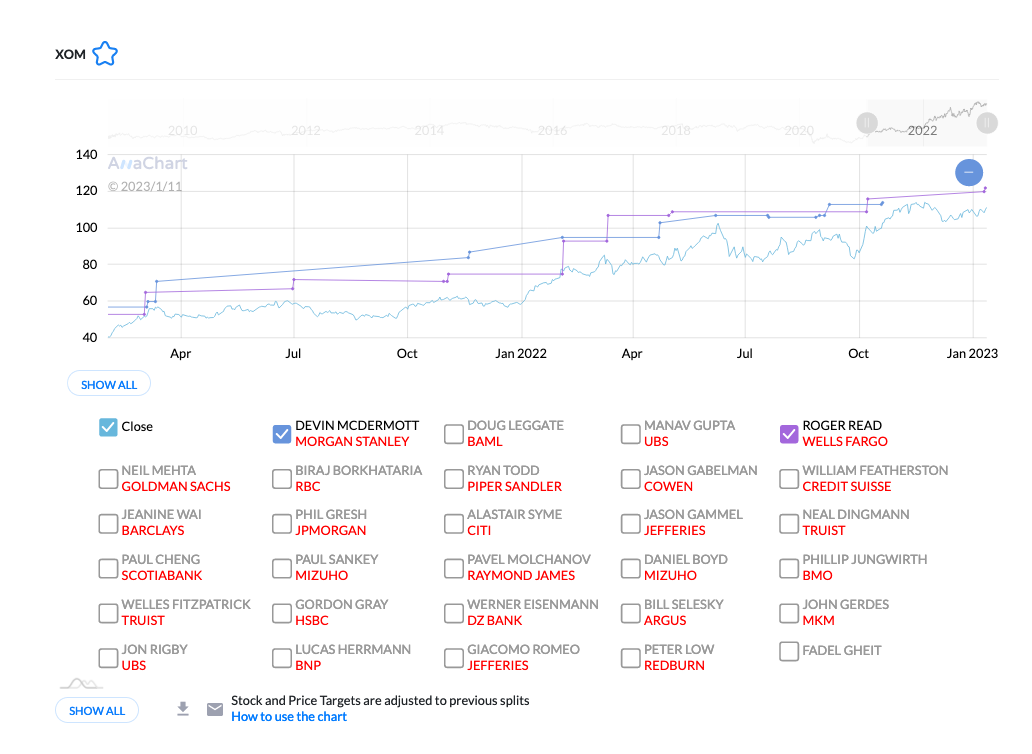
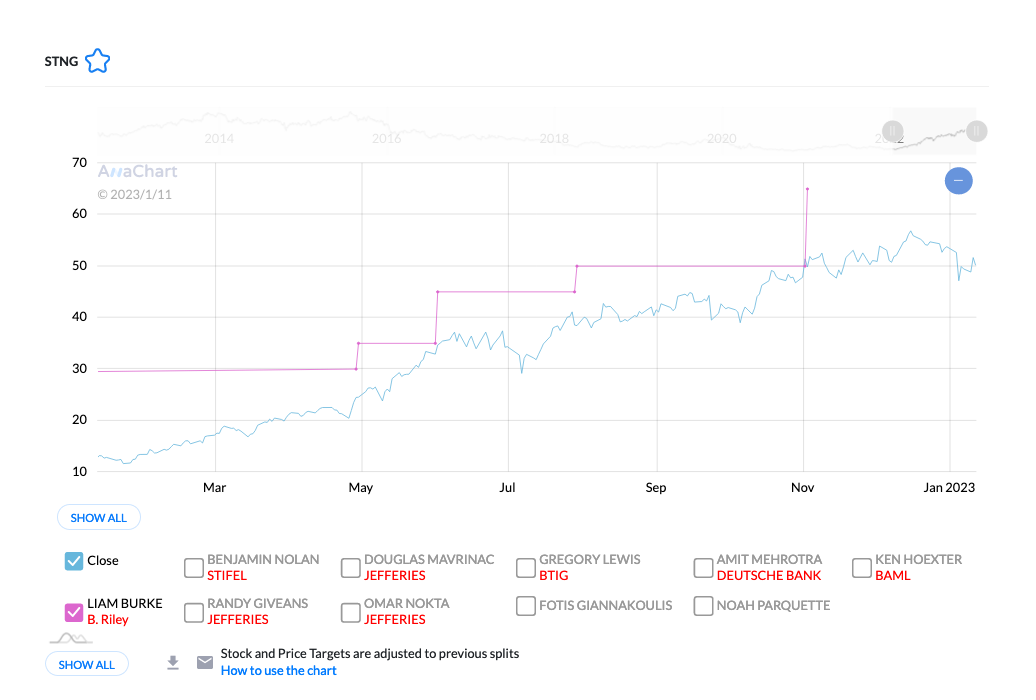
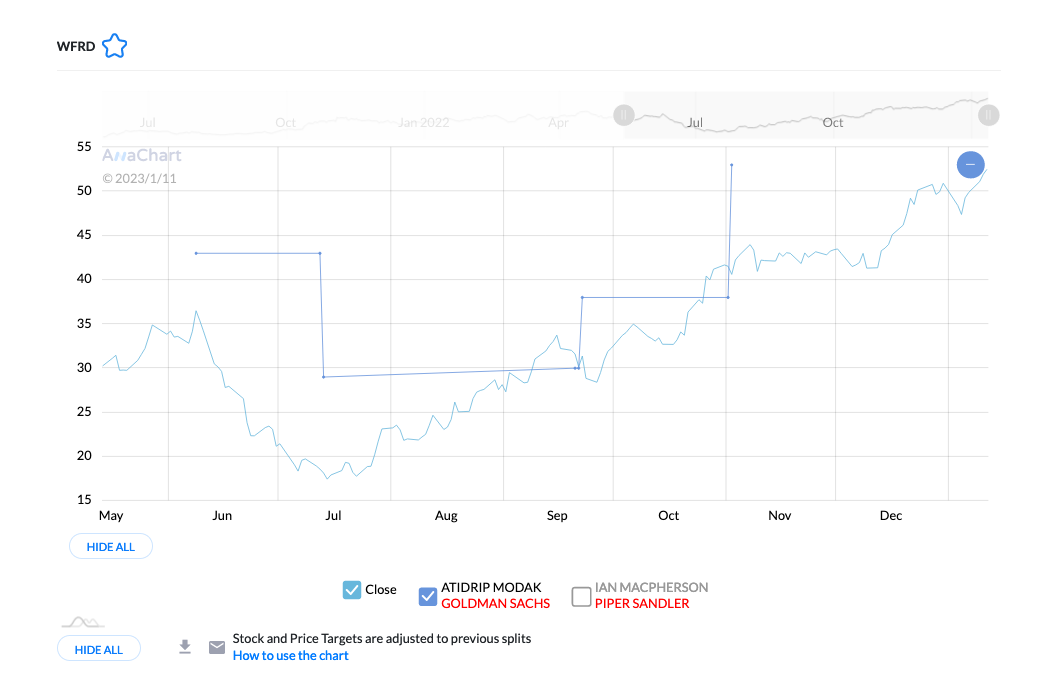
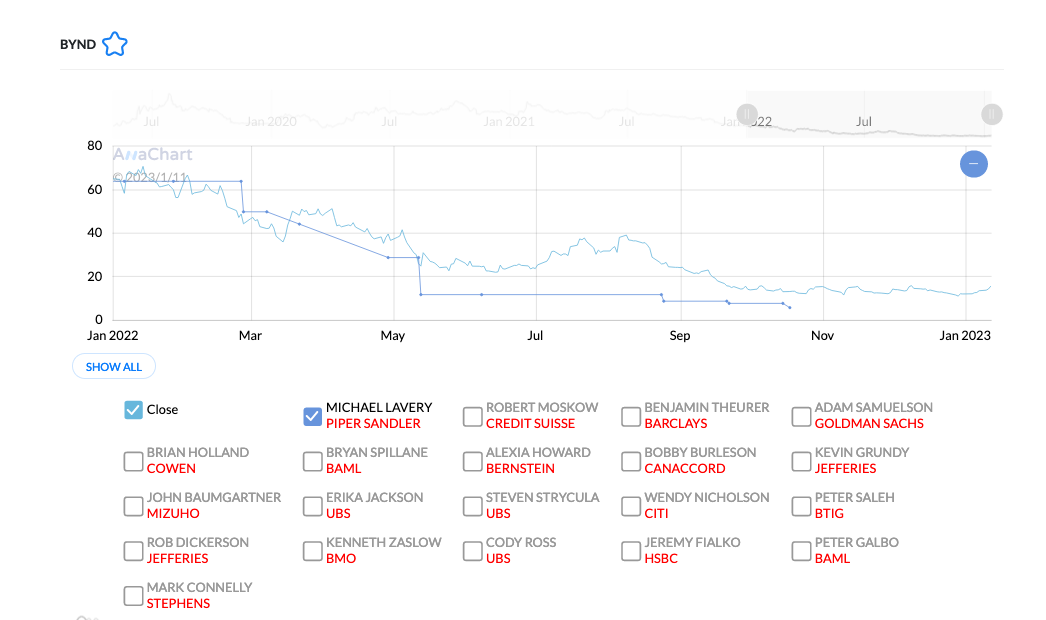
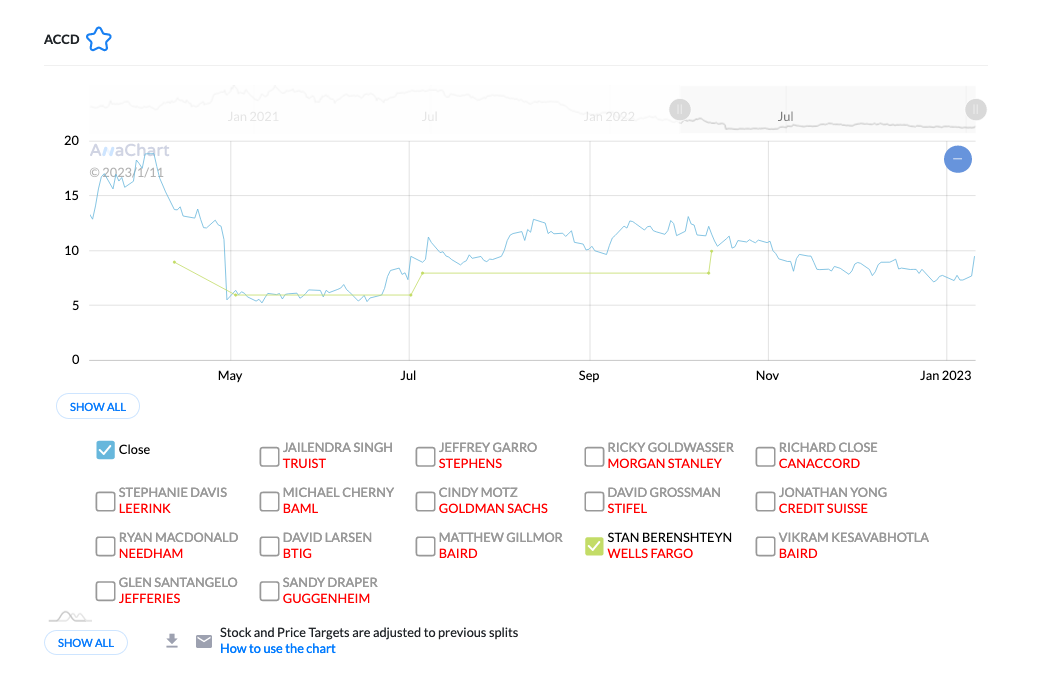
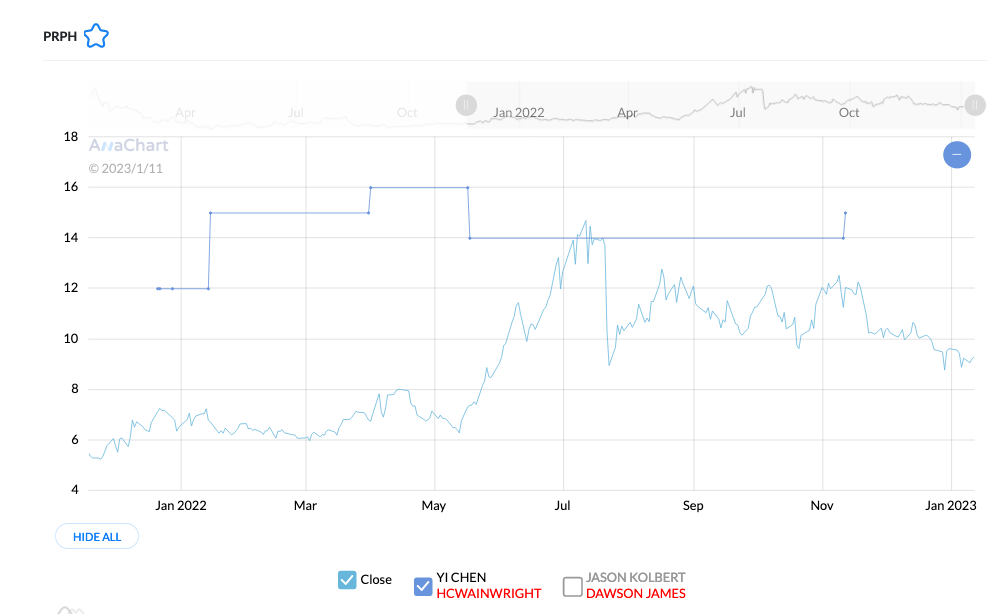
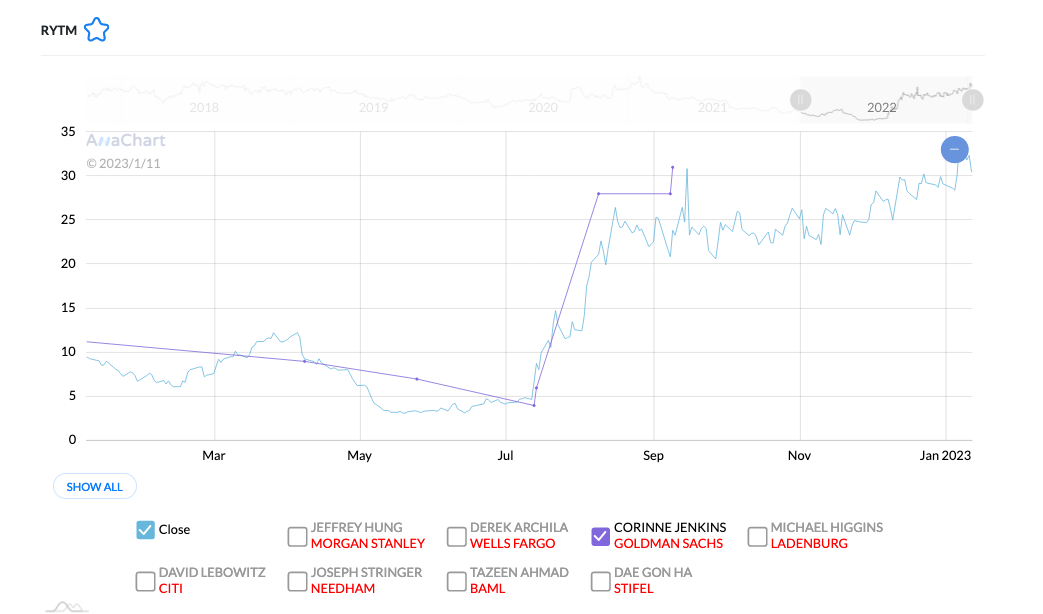
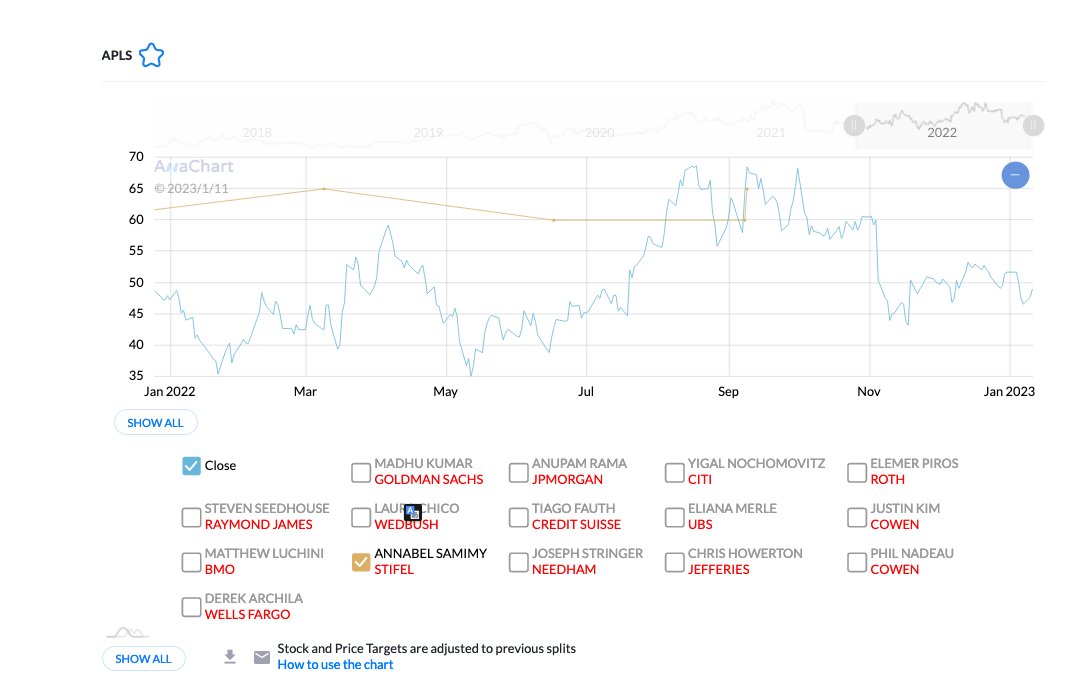
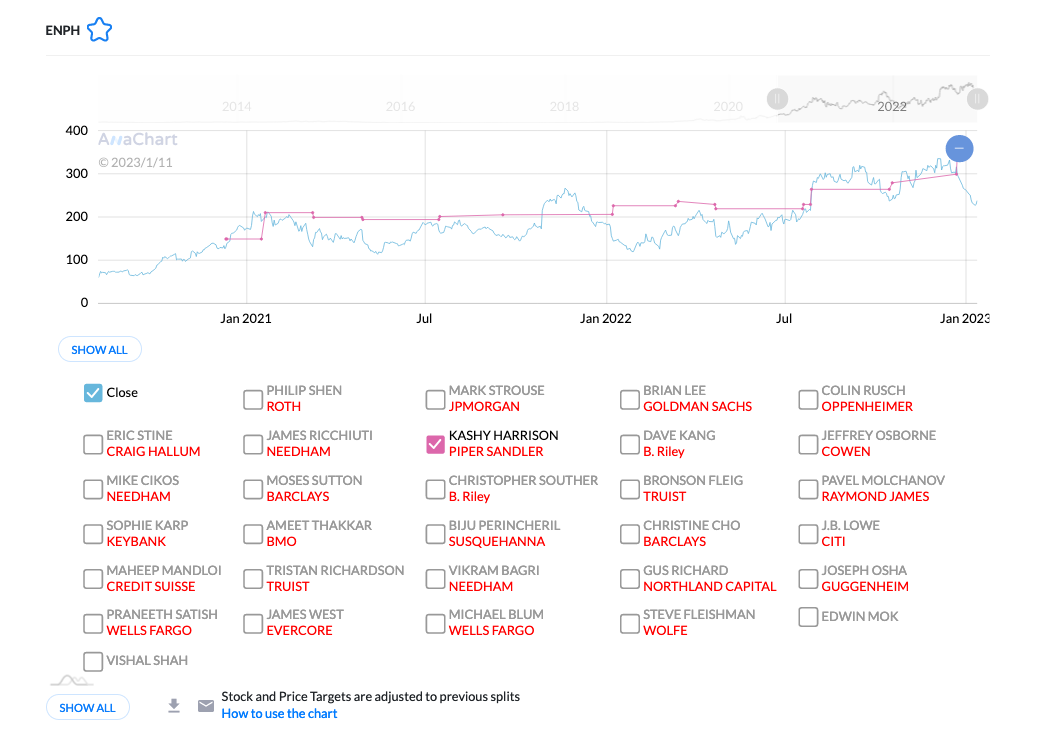
One of AnaChart’s defining advantages is its ability to reveal analyst timing behavior. By plotting analyst price targets directly against actual stock prices, users can observe whether analysts tend to anticipate price moves or revise expectations only after prices have already changed.

Unlike ratings, which compress opinion into broad categories, price targets are absolute values that can be objectively evaluated. This makes it easier to assess analyst accuracy, consistency, and responsiveness.

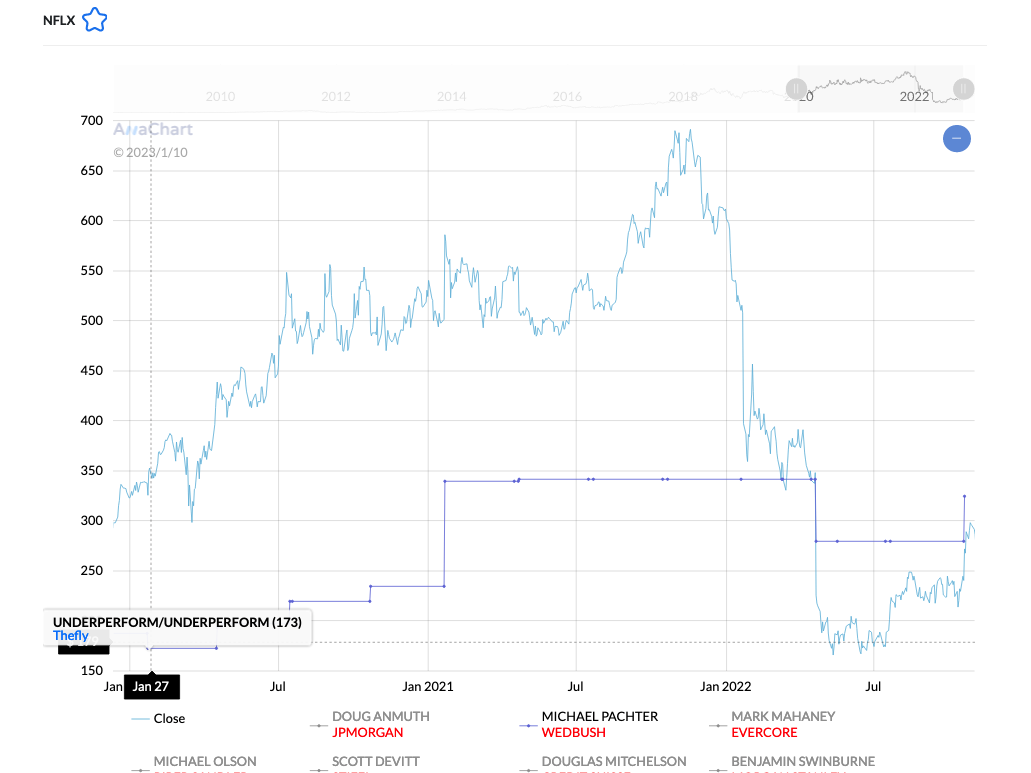
AnaChart also enables visual comparison of multiple analyst price targets on a single chart, preserving variation rather than collapsing it into a single consensus signal. This makes disagreement, dispersion, and convergence across analysts immediately visible — something that aggregated displays cannot easily capture.


How Do You Know Who to Trust?

When processing millions of analyst reports, research notes, and financial publications, data reliability and transparency become critical.

WallStreetZen primarily relies on a single global financial data provider to power its analyst-related information. While this approach simplifies data ingestion and presentation, it also limits source variation, making it more difficult to cross-validate inconsistencies or errors across publishers.

AnaChart was built to address this challenge. Over more than a decade, the platform has documented tens of thousands of inconsistencies and contradictions across financial media sources. Instead of masking these differences, AnaChart incorporates data from multiple public sources, making discrepancies easier to identify and evaluate.

Transparency is another key distinction. WallStreetZen does not display every individual recommendation or price target used in its scoring models, which limits the ability for users to independently scrutinize analyst behavior. AnaChart’s per-stock approach reduces informational compression and makes validation more straightforward.

Screenshot comparison

AnaChart showing Apple AAPL analyst price target history with per-analyst accuracy tracking WallStreetZen Apple AAPL stock analysis showing consensus forecast view


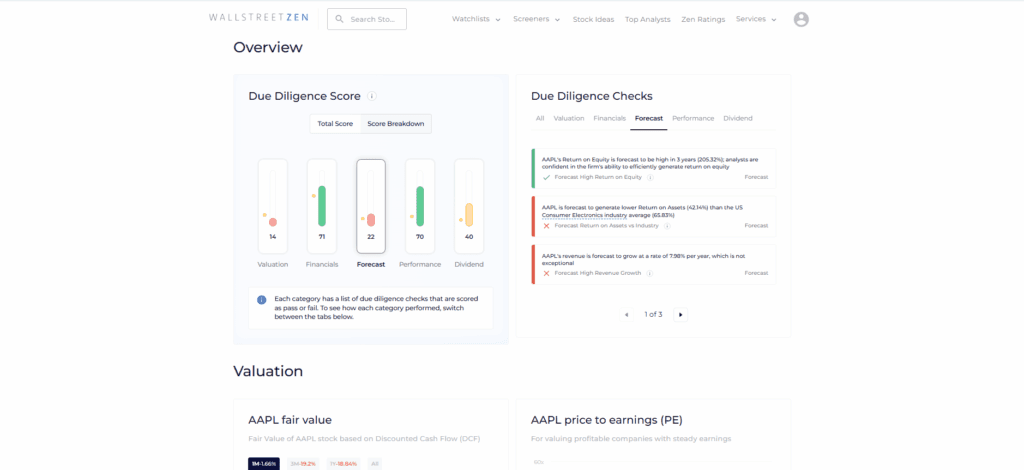
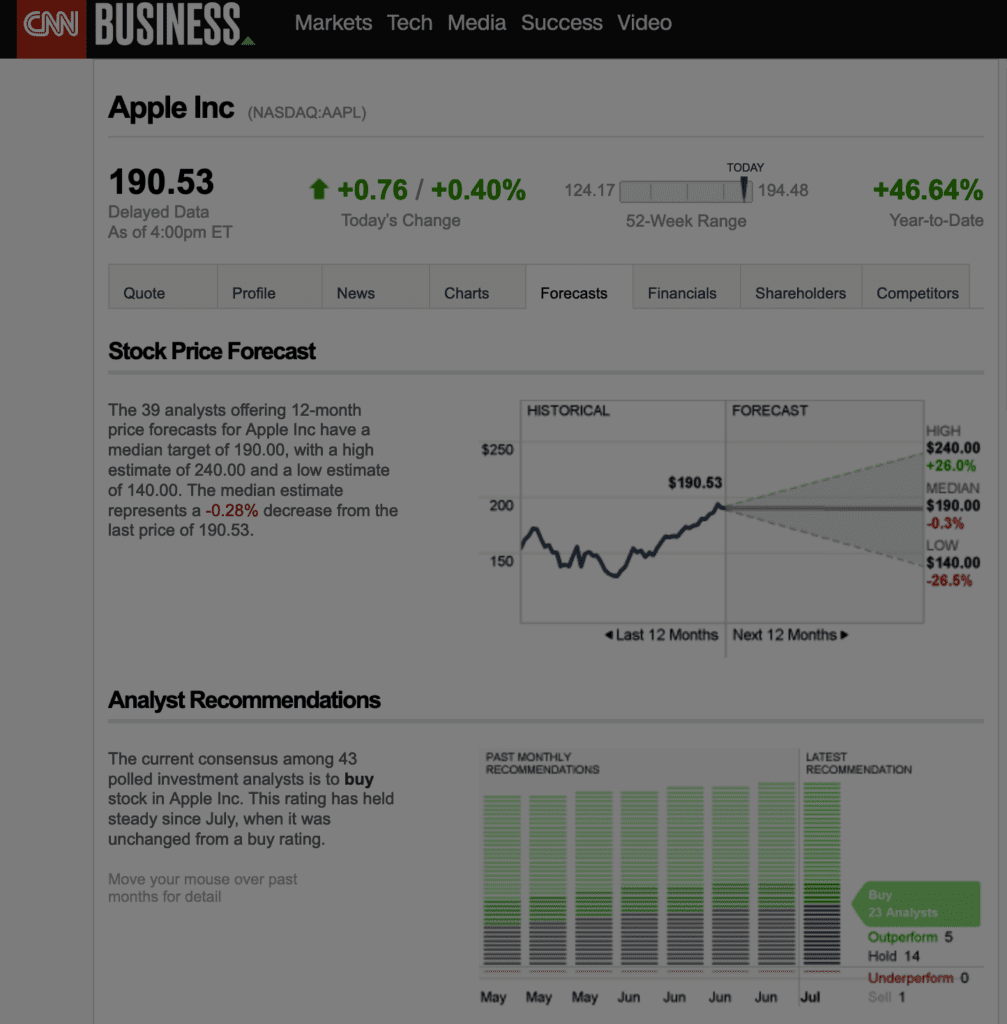
WallStreetZen – Aggregated, model-driven forecasts and due diligence checks with limited visibility into individual analyst price-target history.


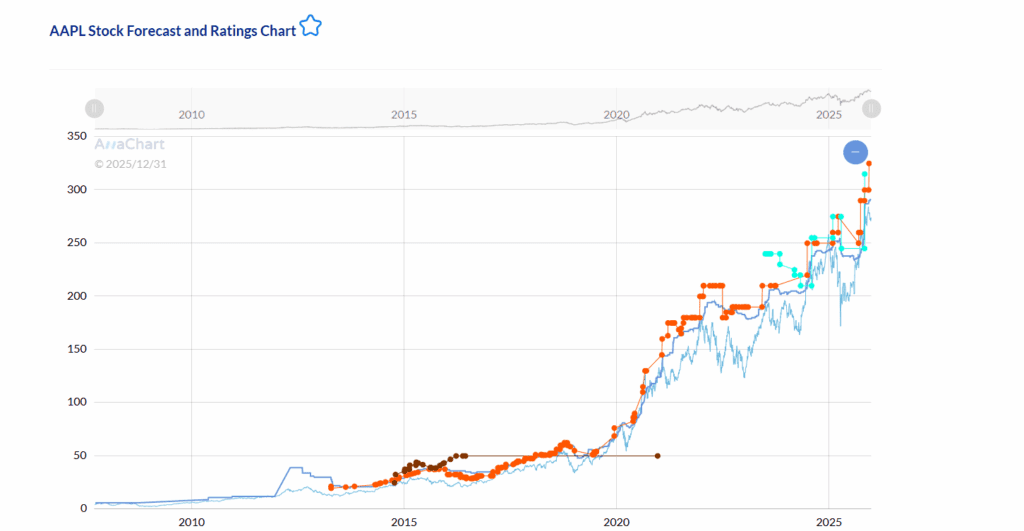
AnaChart – Historical analyst price targets and revisions plotted directly against the stock price, making timing behavior and expectation changes transparent.

As illustrated above, the difference in informational depth is immediately apparent.

Cost Effectiveness

Both WallStreetZen and AnaChart offer free access with limitations. WallStreetZen provides basic research tools and consensus-level insights on the free tier.


AnaChart’s free tier includes access to basic price-target activity charts and performance updates, with six stocks fully accessible without registration via the homepage carousel (including AAPL, AMZN, BABA, MRNA, PFE, and TSLA). This allows users to explore how analyst data is visualized before creating an account.


AnaChart also offers a 7-day free trial of its Advanced membership, which can be canceled before the trial ends. The Advanced plan provides unrestricted access to all stocks and analyst data, including full price-target history, performance scores, multi-analyst comparisons, media source links, and insider trading features.


AnaChart’s Advanced membership is currently priced at approximately $45 per month or $399 per year, with access levels and pricing subject to change as listed on the AnaChart registration page.


What Is the Right Platform for You?

Choosing between AnaChart and WallStreetZen depends on how you incorporate analyst research into your investment process.

Do you rely more on consensus scores and model-driven signals, or do you prefer to analyze individual analyst track records? Do you consider historical price targets and revisions important, or are ratings sufficient? How much transparency do you expect when evaluating analyst performance?

If you value simplicity and high-level confirmation, WallStreetZen may fit your workflow. If you prioritize analytical depth, historical context, and the ability to scrutinize analyst behavior over time, AnaChart may be the better choice.

AnaChart Benefits

AnaChart was created by stock traders for stock traders. Its design emphasizes visual clarity, transparency, and analytical depth, allowing users to focus on information that directly impacts decision-making.

Key benefits include per-stock analyst performance scoring, comprehensive historical price-target databases, and visual tools that reveal how analyst sentiment evolves over time. AnaChart’s methodology is fully transparent, and the platform clearly attributes data to its original public sources.

By preserving variation rather than compressing it into single scores, AnaChart enables investors to see when analysts change their views, how frequently they revise targets, and whether those revisions tend to lead or follow price movement.

AnaChart also provides hourly email alerts, ensuring users receive timely updates when analyst price targets or expectations change.


Conclusion

WallStreetZen has gained popularity by offering simplified, model-driven stock analysis and consensus-level insights. AnaChart provides a complementary alternative for investors who want greater transparency, deeper historical context, and a more granular view of analyst behavior.

With broader access to public analyst price targets, per-stock performance evaluation, and superior visual analytics, AnaChart is designed for investors who take analyst research seriously and want to scrutinize it closely.

For your convenience, we’ve included a WallStreetZen vs AnaChart comparison summary table below.


WallStreetZen vs AnaChart Comparison Summary

Feature WallStreetZen AnaChart
Price targets displayed Limited 700,000+
Historical data depth Limited 15+ years
Performance scoring General per analyst Per-stock per analyst
Multi-analyst comparison One at a time Multiple simultaneously
Data sources Single provider Multiple public sources
Scrutability Limited Full transparency
Monthly pricing $19.50 $45
Annual pricing $150 $399
Free tier Yes (limited) Yes (limited)
Trial period 14 days for $1 7 days


AnaChart is not a provider of financial advice and does not issue recommendations or offers to buy or sell any security. All information is provided “as is,” without warranties or representations of any kind.


Related Reading

🔍 See Real Analyst Track Records on AnaChart

AnaChart tracks 4,000+ Wall Street analysts — see their price target history, accuracy rate, and performance score for any stock.

Explore AnaChart Free →

AnaChart Recognizes Top Analysts’ Performance in 2024

AnaChart Recognizes Top Analysts’ Performance in 2024

 AnaChart, a New York based Fintech company, has identified the top stock research analyst performances which rose to the occasion with their insightful predictions and consistent delivery in the year of 2024. Analysis was conducted using an algorithm which measures each analyst’s forecasts over the year across all the stocks that they cover. In 2024, the majority in the list are represented by experts within the industrials and technology sectors. Recognition is attributed per individual stock forecasting instead of overall performance due the variances between individual securities success.

From the words of AnaChart CEO Joseph Kalish “S&P 500 had over 36% return in 2024 with the hi-tech sector leading the way, still, going on limb and providing price targets that materialize in a timely manner with substantial potential upside and doing so consistently and outperforming the market is something that might be considered impossible by some members of the finance community yet here we are”

The winners for 2024 are:

  • Daniel Ives, Wedbush, Technology, Palantir Technologies.
    AnaChart’s stock picker of 2024 for timely selecting of Palanatir with three consecutive calls generating over 20% each materializing within less than six months. The only analyst who was bullish on the stock consistently throughout the year while the stock rose by nearly 300%.
  • Chris Olin, Northcoast, Technology Intel.
    Winner of the AnaChart Big Short awards for 2024. The only analyst who was consistently bearish on the hardware manufacturer and provided a validated opinion. The analyst’s price targets this year were kept at 66% discount from the stock pick at the beginning of the year. Not an easy task when the S&P 500 had its best year since 2016 more so with the technology sector leading the market .  

Honorable mentions for analysts that had repeated double digit returns with their price targets


About AnaChart: revolutionizing the fintech industry as an equity research support platform. Founded in 2020, it uses “radical transparency”[1] to provide up-to-date price targets and ratings from top stock analysts for each company. From past performance history to current projections, AnaChart offers an unprecedented view into analyst insights that can vastly improve investment decision making process.

[1] Radical Transparency is a term coined by Ray Dalio of Bridgewater to encourage an open and honest dialogue, allowing the best thinking to prevail.

Related Reading

Annual Top Analysts Series:
2022 | 2023 | 2024 | 2025

🔍 See Real Analyst Track Records on AnaChart

AnaChart tracks 4,000+ Wall Street analysts — see their price target history, accuracy rate, and performance score for any stock.

Explore AnaChart Free →

AnaChart Recognizes Top Analysts’ Performance in 2023

AnaChart Recognizes Top Analysts’ Performance in 2023

(Jan. 9, 2024, New York City). Today, AnaChart.com, a New York fintech company that tracks sell-side stock analysts’ stock picks, ranked the top eleven research analysts whose stock picks outperformed during 2023. AnaChart chose these analysts for their insightful research and consistent stock pick returns.


AnaChart’s algorithm measures each stock analyst’s recommendations and the related price return. This metric covers all the stocks that the various analysts cover.


The majority of the top analysts cover stocks within the healthcare and technology sectors. AnaChart tracks the performance of each stock research report and target price recommendation by these analysts.

AnaChart’s CEO, Joseph Kalish, said, “S&P 500 returned over 24% in 2023. Many sell-side stock analysts outperformed this rate with their stock picks. AnaChart has identified those whose research picks excelled.”

The winners for 2023 are:

  • Mani Foroohar, (SVB LEERINK), Healthcare analyst – Top Pick: Moderna.
    Winner of the AnaChart Big Short awards for 2023. From 2020 through 2023, Foroohar’s positive opinion on Moderna remained firm. This bucked the consensus from other analysts. Foroohar’s price targets rose 87% from the stock’s peak price in 2021, and gained 63% during 2023.

Honorable mentions for other analysts whose stock picks have had repeated double digit returns:

For further information, contact Joseph Kalish, CEO, at [email protected] or Mark Hake, CFA, Chief Strategy Officer, at [email protected].

About AnaChart: AnaChart.com is revolutionizing the fintech industry as an equity research support platform. Founded in 2020, it uses proprietary technology to track up-to-date price targets and ratings published by top sell-side stock analysts. AnaChart provides tools to improve investors’ views on stocks. It offers a basic free version covering analysts’ picks on the top 100 NASDAQ stocks, and a subscription service covering over 5,000 stocks and 4,000 sell-side analysts.

Annual Top Analysts Series:
2022 | 2023 | 2024 | 2025

Last Updated: March 2026. This article has been reviewed and updated to reflect current market conditions and the latest analyst data available on AnaChart.

🔍 See Real Analyst Track Records on AnaChart

AnaChart tracks 4,000+ Wall Street analysts — see their price target history, accuracy rate, and performance score for any stock.

Explore AnaChart Free →

So Many Analysts…So Little Time…How to Take Tips from the Best

So Many Analysts…So Little Time…How to Take Tips from the Best

By: Miriam Metzinger


If you’ve purchased stock in Apple only to see it drop on a Sell rating from a prominent analyst, you may be experiencing buyer’s remorse…or maybe not.


In a market that is often fickle and volatile, it’s not surprising that many investors–and financial media–hang their hats on calls of individual analysts and firms.

Sorting Through Stock Analyst Calls


There’s no doubt, however, that many of these analysts, along with the stocks they cover, may be overrated. However, there are certainly many analysts whose calls are worth paying attention to and have a history of strong performance. The key is how to find these analysts, determine which stocks they have been consistently right or wrong about, and under what circumstances they have performed best.


There’s no accident that this sounds a bit like the considerations investors make before choosing stocks and sectors. In fact, it takes research and a working knowledge of performance and trends to select which analysts to pay attention to. Fortunately, you don’t need a series of trial and error runs to gain this experience–tools and like Anachart can give you a full picture of analyst performance.

The Problem with Analysts

The proliferation of financial media and analyst calls can be challenging to sort out. Some investors, particularly those who are new to investment research, may decide to dispense with the noise and do their own research. After all, if analysts can look at financial news and quarterly earnings reports, why can’t anyone?


The other problem is the bias that some analysts may have. Some analysts may not want to fall out of the good graces of executives of certain companies. This may cause analysts to tilt bullish rather than bearish to avoid burning professional bridges.


According to a 2022 study in the International Review of Economics and Finance, stock analysts were found to be more bearish in earnings predictions compared to actual outcomes, particularly for stocks that issued a high dividend.


The Value Analysts Provide

So why listen to analysts at all? The primary reason is that, regardless of occasional bias and unsuccessful calls, analysts are still experts in the sectors they cover and the markets.


Most investors can’t devote their entire time to investing and researching stocks and sectors and have day jobs. Analysts spend their days (and often nights) researching the market in real-time, attending conferences, and interviewing companies. This gives an analyst a clear edge over the average investor in predicting the market and direction of stocks.


Also, it can’t be denied that certain analysts and firms have had considerable influence and success in specific sectors, and there are many tales of obscure stocks getting discovered through analysts’ recommendations with huge profits for investors.

The Right Way to Examine Analyst Performance

However, in spite of the undeniable analyst successes, even the top analysts aren’t right all of the time. Taking a detailed look a specific analyst’s calls on individual stocks or examining instances when the analysts have accurately predicted market movements is certainly valuable.


Fortunately, Anachart makes examining analyst calls easier. This valuable tool allows you to visualize and compare calls made by analysts about the same stock and to see the difference between calls and the actual performance of the stock.


Anachart eliminates time-consuming research and collecting information from separate websites or financial news outlets. All of the calls from thousands of analysts are available at your fingertips.


Register for your 30-day Anachart trial today. 

Related Reading

🔍 See Real Analyst Track Records on AnaChart

AnaChart tracks 4,000+ Wall Street analysts — see their price target history, accuracy rate, and performance score for any stock.

Explore AnaChart Free →

Consider the Source: How to Evaluate a Stock Analyst

Consider the Source: How to Evaluate a Stock Analyst

By: Miriam Metzinger

When seeking investment advice, the sky is the limit. Financial media has grown exponentially, from traditional cable channels with round-the-clock investment advice, to financial websites and stock tips on social media.


As in any other area, listening to the experts–in this case, stock analysts, is recommended. Although many investors are familiar with the process of analyzing stocks, it’s useful and often profitable to see what the analysts have to say about specific stocks and what can lead them to change their ratings.


Just as it’s important to take a look at a company’s quarterly earnings report and financials, it’s also essential to analyze the analysts and evaluate their performance before taking their advice.


Know Your Stock Analyst:

Consider the following:

What Are Their Credentials?

Has the analyst worked in the field or is their background mainly in finance? Do they specialize in analyzing specific sectors are they concerned with the movement of the market in general?

There are pros and cons to any of these scenarios, but the main thing is understanding an analyst’s background and credentials to determine whether they are focused on the future of a specific industry or general market trends.

Are They Buy-Side or Sell-Side?

Any visitor to a financial site runs across the terms buy-side or sell-side. A buy side analyst usually works for a mutual, hedge, or pension fund and is performing research so they can make recommendations to the firm they are working for. Sell-side analysts release research often to encourage institutional investors to use the trading desks of their own firms.


Sell-Side analysts have gotten a bad rap in the recent past, and it’s often believed that what they do is a form of marketing. In response to criticism, investment firms have cordoned off their research from their business departments to ensure they are separate.


However, since analysts are required by the SEC to disclose whether their firm holds a position in a stock, and there is transparency inherent in stock analysis, none of these apparent biases are a secret. It’s important to consider how the analysts’ firm is invested before taking investment advice.


Large or Small Firms?

It may be tempting to trust analysts from large, well-known investment firms. However, in spite of reputation, the performance of individual analysts can vary. Sometimes large firms that hire many analysts may be less selective, and it isn’t advisable to become loyal to analysts from specific firms, but instead, to look at individual performance.

Track Their Performance

The real indicator of whether an analyst is reliable or not is to look at their performance. This means analyzing their ratings, and whether or not their calls were accurate or not.


This may mean keeping tabs on financial news, whether it’s CNBC, Seeking Alpha, or other media that reports analyst calls. The real way of telling whether a stock analyst’s call is successful or not is to look at how the stock performed following the prediction.


However, what’s the best way of getting a full picture of an analyst’s general performance? Looking up individual calls and results can certainly be time-consuming. Fortunately, there is an easier way of tracking analyst performance.

Why AnaChart Will Give You an Edge

Anachart takes the time and guesswork out of researching stock analysis. On the site, you can look up a specific stock and see the major calls from thousands of analysts. Alternatively, you can examine the calls of individual analysts or compare the performance of one analyst with many others.


In one image, you can observe the actual path of the stock and compare it to the predictions of individual or multiple analysts. Anachart isn’t merely a database of information, but a single image can provide a full picture of analyst performance.


Anachart will help you filter out the noise and focus on the analysts who have a track record of success rating stocks and sectors you care about most. Start your 30-Day Trial today. 


Related Reading

🔍 See Real Analyst Track Records on AnaChart

AnaChart tracks 4,000+ Wall Street analysts — see their price target history, accuracy rate, and performance score for any stock.

Explore AnaChart Free →

How to use AnaChart for your investment research?

How to use AnaChart for your investment research?

By: Joseph Kalish

We will try to lay in this post out what we have identified where AnaChart as useful in unique ways.

AnaChart is the only site that shows current AND previous stock price targets and rating (with the links as well as to news media that published it). Other sites show only previous ratings but not previous price targets.

You came up with a news item about an analyst giving an opinion about a stock that you have interest in and you wish to understand how successful they were before

On Anachart you can find the analyst, choose the relevant stock and see how hers/ his price targets and rating compared to the stock price.

By accessing the previous price targets you know instantly if the respective analysts was leading or lagging with his recommendation and by how much.

For example if looking at Daniel Ives from Wedbush when covering Tesla – we see that he did very well when raising his price targets and shifting from Neutral to Outperform. You can also see that in the first part of 2022 Ives didn’t adjust lower his price targets but later he did which shows a change on his perspective.

So the next time you receive news regarding Tesla you can have substantially better perceptive than anything else on the market.

This GIF shows stock analyst Daniel Ives from Wedbush covering Tesla over the last five years.

If you don’t have access the previous price targets then you can’t have a perspective on the current one and then you are at the mercy of some score that is not very useful.

You wish to follow analysts with a proven track record on a specific stock

AnaChart is the only site that provide a performance score per stock and not per the entire work history of the analyst.

The idea behind the decision to do so is that an analyst do better on some stocks than with others.

When wishing to know which analysts performed better simply go to the receptive stock, go to the performance of scroll down, where you can sort each stock according their respective score.

The formula on which AnaChart provides the performance score per analyst on each stock is fully transparent.

Analysts that provide price targets that are not realistic IE the stock never reaches them have a score of zero for each such price target.

The longer it takes the stock to get to that price target the lower the score and the same if the price target is closer to the stock price on the day it was published.

This way analyst that provide price targets that are consistently met and within a reasonable time frame have higher scores.

Scores are averaged over the time that the analyst had been covering the stock.

You wish to know exactly where each analysts stands on your stock

Picture this – you’re trying to make an informed decision about investing in a particular stock. You come across an average price target or rating summary made from combined anonymous analysts. It’s a single, neat number, but what does it really tell you?

Now, compare that to having a list of price targets from named analysts, complete with dates. It’s a whole different ballgame, right?

Here’s why. Knowing individual price targets offered by named analysts not only gives you a range of perspectives but also allows you to peek into the minds of these market gurus. It offers a more detailed, nuanced picture, highlighting diverse opinions that exist for that particular stock. And let’s not forget, the date attached to each prediction matters. It’s like a time stamp that takes into account the market situation, industry trends, and other critical events at that particular time.

And the cherry on top? You can easily research the track record of each analyst, measuring their past predictions against actual outcomes. You get to know who’s been consistently accurate (or not), which could further guide your investment decisions. The average price target, on the other hand, is like a faceless crowd-sourced number. It lacks personality, detail, and context. So, next time you’re hunting for investment insights, remember – it’s not just about a single number. It’s about the who, the when, and the why behind each prediction. Invest smart!

Related Reading

🔍 See Real Analyst Track Records on AnaChart

AnaChart tracks 4,000+ Wall Street analysts — see their price target history, accuracy rate, and performance score for any stock.

Explore AnaChart Free →

AnaChart Top Performing Stock Analysts for 2022

AnaChart Top Performing Stock Analysts for 2022

By: Joseph Kalish

As we start 2023 AnaChart is releasing its 2022 top stock performing analysts for this year.

Contrary to the press release we can put more context into the why and how.

  1. MIchael Pachter, Wedbush, Communication Services.

AnaChart’s stock picker of 2022 for outstanding ability to interpret his valuation in a timely manner with both long and short calls on Netflix (NFLX) . His at making timely valuations with long and short calls has led to over 40% potential upside or downside being realized.

Michael has been short on Netflix for the last three years, he remained bearish even when the stock went up by over a hundred percent, he got ridiculed on forums for his stance but he didn’t waiver and then the stock went down to its originals levels justifying every decision that Michael took. And when NFLX went to 250 Michael became bullish, set a price target over 40% above and predicated that it would get there within less than a year, and it did.

  1. Ryan Brinkman, J.P. Morgan, Consumer Cyclical Tesla (TSLA).

Winner of the AnaChart Big Short awards for 2022. Through 2019 and into 2022, the analyst’s opinion of Tesla remained unchanged. Last year his forecast was proved correct as Tesla lost over two-thirds of its market value last year, meeting his valuation.

  1. Ann Hynes, Mizuho,  Healthcare – Molina Healthcare (MOH).

2021 was a good year for Ann on Molina and 2022 was no different and although the stock took a dive at some point, the Mizuho analyst didn’t waiver and her resolve paid off.

  1. Dan Dolev, Mizuho, Technology – Toast (TOST).

Dolev was bearish on Toast since 2021 with close to 33% in potential downside, his second, third, fourth and fifth price targets were all met and within a few weeks to a few months


  1. Mani Foroohar, SVB Leerink, Healthcare – Arrowhead Pharmaceuticals (ARWR).

Mani is quite famous for being negative on Moderna, however contrary to, with Arrowhead his bearish forecast was on point with three years stance coming to fruition 50% down in 2022.


  1. Adam Jonas, Morgan Stanley, Industrials – Avis Budget Group (CAR).

Morgan Stanley analyst Adam has been proven correct three times over the last year with regards to his underweight rating of rental giant stock. Each time it rose significantly for a month before subsiding down again almost exactly to his price targets.


  1. Kate Mcshane, Goldman Sachs, Consumer Cyclical – Bed Bath & Beyond (BBBY).

Kate Mc Shane of Goldman Sachs had a pessimistic outlook for Bed Bath & Beyond stocks in the summer 2020. This vision proved accurate as their stock prices plummeted from 50$ to 14$ by 2021 and continued on a downward trajectory, hitting 7$, exactly as she predicted last year.


  1. Ben Kallo, Robert W. Baird, Technology – First Solar (FSLR).

Ben has been almost exclusively positive on First Solar since 2014 and in 2022 this point of view paid off as the stock more than doubled in value. The analyst price targets were consistently met and given well in advance.

  1. Emily Chieng, Goldman Sachs, Basic Materials – Steel Dynamics (STLD).

The analyst delivered precise price targets ahead of schedule, consistently hitting the mark with her projections as the stock doubled in market share in 2022.

  1. Roger Read, Wells Fargo, Energy – Exxon Mobil (XOM).

  2. Devin Mcdermott, Morgan Stanley, Energy – Exxon Mobil (XOM).

Both analysts from Wells Fargo and Morgan Stanley consistently surpassed price targets, showcasing their ability to make well-informed projections in a timely fashion for the energy giant that doubled in value. Far from all energy stocks has such growth last year.


  1. Liam Burke , B. Riley, Energy – Scorpio Tankers (STNG).

Consistent upgrading of the price targets in advance and well knowledge while the stock price rising for 500% from $10 to $over 50.


  1. Atidrip Modak, Goldman Sachs, Energy – Weatherford International (WFRD).


  1. Michael Lavery, Piper Sandler, Consumer Defensive – Beyond Meat (BYND).

  1. Joseph Mckay, Wells Fargo, Healthcare – Civitas Resources (CIVI).


  1. Stan Berenshteyn,Wells Fargo,  Energy – Accolade (ACCD).

  1. Yi Chen, H.C. Wainwright, Healthcare – ProPhase Labs (PRPH).

  1. Corinne Jenkins, Goldman Sachs, Healthcare – Rhythm Pharmaceuticals (RYTM).

  1. Annabel Samimy, Stifel, Healthcare – Apellis Pharmaceuticals (APLS).

  1. Kashy Harrison, Piper Sandler, Technology – Enphase Energy, Inc. (ENPH).


Annual Top Analysts Series:
2022 | 2023 | 2024 | 2025

Last Updated: March 2026. This article has been reviewed and updated to reflect current market conditions and the latest analyst data available on AnaChart.

🔍 See Real Analyst Track Records on AnaChart

AnaChart tracks 4,000+ Wall Street analysts — see their price target history, accuracy rate, and performance score for any stock.

Explore AnaChart Free →